 The $0$ on a graph is the reference point for all other points. The graph of a $0$ function has an output of zero irrespective of any input.
So how do we draw the $0$ on a graph in a number line? To draw the graph of $0$ for a function, we will say that “x” can take any value on the vertical axis and “y” can take any value of the horizontal line; hence, we will be left with a dot at $(0,0)$, and we can plot it as:
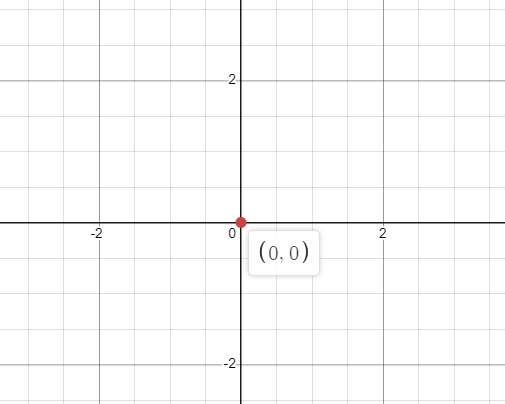
Similarly, if y $= 0$ any value of “x,” it will still be a zero on a graph. In this guide, we will learn about the $0$ function and plotting $0$ on a graph.
What Is Meant by 0 on a Graph?
“$0$” on the graph can have three definitions:
1. When x=0: This type of graph will be along the y-axis and will be continuous. For example, (0,2), (0,4) can be plotted as x =0.
2. When y =0: This type of graph will be along the x-axis and will be continuous. For example, 4,0 on a graph and $3, 0$ on a graph both are examples of y = 0.
3. When both x and y = 0: It is the origin point of the plane (0,0).
Suppose we are given an equation for line y = mx + c. Here, “m” is the slope of the line while “$c$” is the y-intercept, now assume if $m = 0$ and $c = 0$ then:
$y = 0x + 0 = 0$
As the slope is zero and y-intercept “c” is also zero, we can write it as $(0,0)$. So this states that no matter what the value of “$x$” is, the value of “$y$” will always be zero. Such representation can also be called a zero function.
$(0,0)$ On a Graph Is the Reference Point
A graph is a collection of points. Each point has an x-value and a y-value, but we need a reference point first to find the x-value or the y-value of any point. For example, if a point has an x-value equal to $5$, it means that it is $5$ units away from the reference point along the x-axis.
Similarly, if a point has a y-value equal to $10$, it is $10$ units away from the reference point. Hence, to locate any point on a graph, we need a reference point first. We can denote this reference point by $(0,0)$ on the graph.
Zero on a Graph and Zero Function
The zero on a graph, when represented as $(a,0)$, is the same as the zero function. This means no matter the value of “$x$” if $y = 0$, it will be called a zero function. In mathematics, we deal with different types of functions while solving numerical problems. Functions have domain and range; a zero function can have a domain of any real number, but the range or value “$y$” will always be equal to zero.
Zero on a graph or zero function can also be called a constant function as the value of output does not change with respect to any input value. So, for a zero function, the input value can have any real number value while the output value of “$y$” is fixed at $0$; therefore, it is a constant function but not a one-to-one function.
How To Draw y=0 on a Graph
The next question in your mind would be how do we draw a graph for $f(x) = 0$. The graph for a zero function is similar to all constant functions parallel to the x-axis. As we discussed earlier, “y” has a constant value, so any function can be taken as a constant function if f(x) = c, where “c” is constant. The function $f(x) = c$ can also be written as $y = c$.
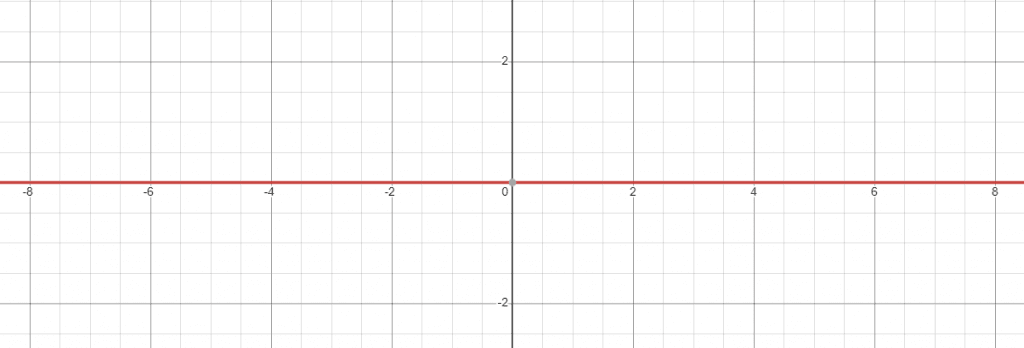
Since the out value or the range of $0$ on a graph will always be zero, hence the line of the x-axis will be the graph itself for this function, and the graph will be named as $y = 0$ or $f(x) = 0$ or $0$ on a graph. We can plot it as:
Properties of Zero Function
Any function has many characteristics, and each characteristic plays an important part in the properties of zero function. The various characteristics of a function can be named as domain and range, slope, limit, differentiability, and continuity of a function.
As we discussed earlier, the zero function is a constant function, and its properties are quite similar to that of a constant function. Some of the properties of zero function are stated below.
Zero Function Slope: We have discussed earlier that for the equation of line $y = mx + c$ to be equal to a zero function, the value of “$m$” and the y-intercept “$c$” will be equal to zero. Hence, the final form of equation will be written as $y = 0x + 0$. So, if we compare the final equation with the original equation, we can easily conclude that the y=0 slope is the slope of a zero function or $0$ on a graph.
Zero Function Domain and Range: We can say that zero function is linear because no matter the input value, the value of output or range will always be zero. That’s why zero on a graph or a zero function is mostly represented using a linear equation. Even if we use the non-linear equation, if it is zero function, then its range will always be [0]
Differentiation of Zero Function: We have learned in calculus that the derivative of any constant function will always be equal to zero, and the zero function is no different. We know that a zero function is a constant function and the derivative of a function is the slope of the function at a given point. As we discussed earlier, the slope of the zero function is zero, hence the derivative of the zero function is always zero.
Zero Function limit: In the case of limit, the zero function has the same properties as a constant function. Hence, the limit of the zero-function is always equal to zero.
Zero Function Continuity: We know that zero function is a constant function that is parallel or equal to the whole x-axis line, extending continuously left and right with no limits. We also know that continuous parallel lines represent any constant function. Hence, they are continuous. Zero function is also a constant function, so it is continuous.
Example 1: What will be the limit of the function $y = 0$ when x approaches infinity?
Solution:
We can write $y = 0$ as $f(x) = 0$, and we know that it is a zero function as well as a constant function. For a constant function, the value of the limit is always equal to its output since, in case of a zero function, the output is always zero; hence the limit of the given function is zero.
Example 2: Is the function $f(x) = 3$ a zero function or not?
Solution:
The function $f(x) = 3$ or $y = 3$ is a constant function but not a zero function as its range will always be equal to 3. Any function classified as a zero function should have a range of output equal to zero.
Examples
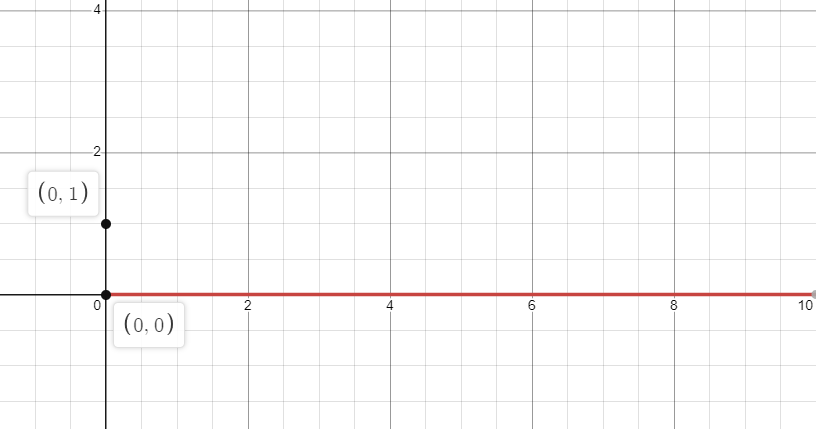
1. What Would a Graph of 0^x Look Like?
Answer: The answer to this question can be divided into three parts.
The graph of $0^{x}$ will be undefined when the value of x is < 0.
The $0^{x}$ graph will be equal to 1 when $x = 0$ because anything to power 0 equals 1.
The $0^{x}$ graph will be equal to zero when x is > 0. So, the graph will look like:
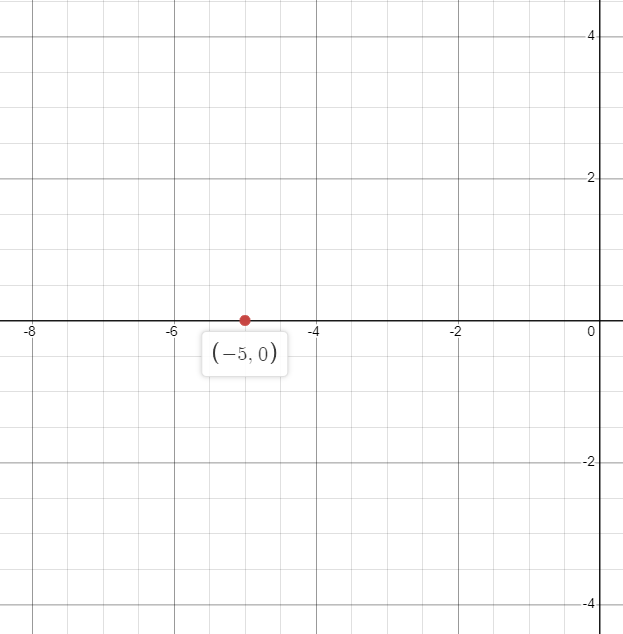
2. Plot (-5,0) on a Graph
Answer: The graph for $(-5,0)$ can be plotted as:
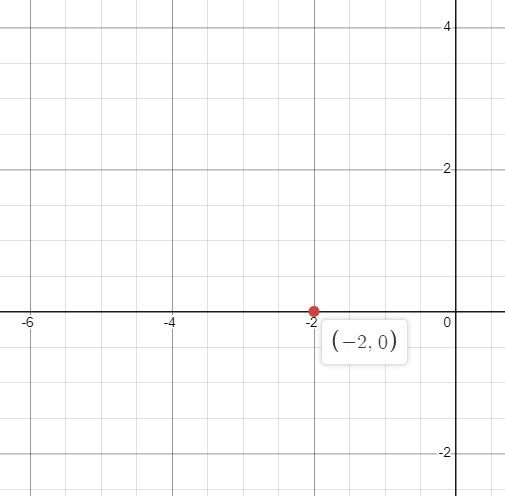
3. Plot (-2,0) on a Graph
Answer: The graph for $(-2,0)$ can be plotted as:
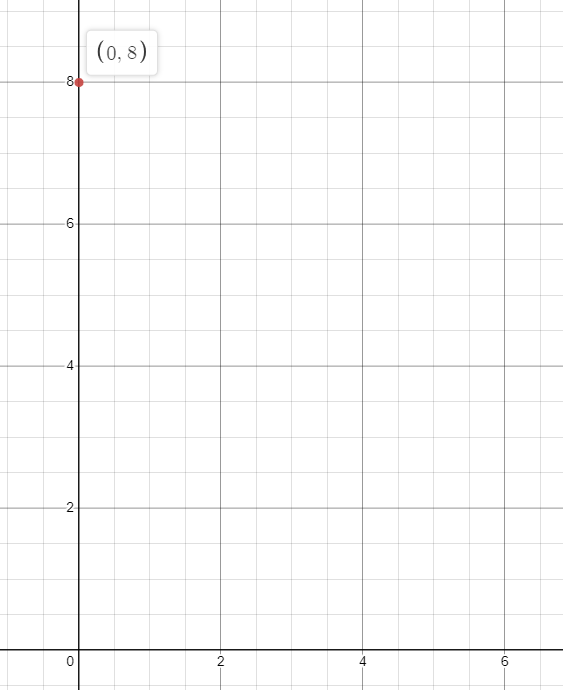
4. What Is 8=0 on a Graph?
Answer: 8 = 0 can be written as (0,8). Here, y-coordinate has the value of 8 while the value of x will always be zero, and we can plot it as:
5. Is the Origin of the Graph Always at (0,0)?
Answer: Yes, the origin for a 2-dimensional Cartesian plane will always be $(0,0)$. For the 3-dimensional plane, the origin will be written as $(0,0,0)$.
Conclusion
Let us conclude our discussion and summarize what we have learned so far.
• $0$ on a graph can be written as (0,0), (a,0) or (0,a).
• Zero on a graph can also be called a zero function as the slope and y-intercept in both cases are the same.
• Zero function or zero on a graph is a constant function as no matter the input value, output will always be zero.
• The properties of the graph of zero function are the same as that of a constant function.
Understanding $0$ on a graph and zero function will be much clearer after reading this guide. Hopefully, you can now explain this topic in detail to your friends and colleagues.