- Home
- >
- Tally chart – Explanation & Examples
JUMP TO TOPIC
Tally Chart – Explanation & Examples
 The definition of the tally chart is:
“The tally chart is a chart used to record and count the frequencies of your data using tally marks”
In this topic, we will discuss the tally chart from the following aspects:
- What is the tally chart?
- How to make a tally chart?
- How to read a tally chart?
- The role of a tally chart
- Practical questions
- Answers
What is the tally chart?
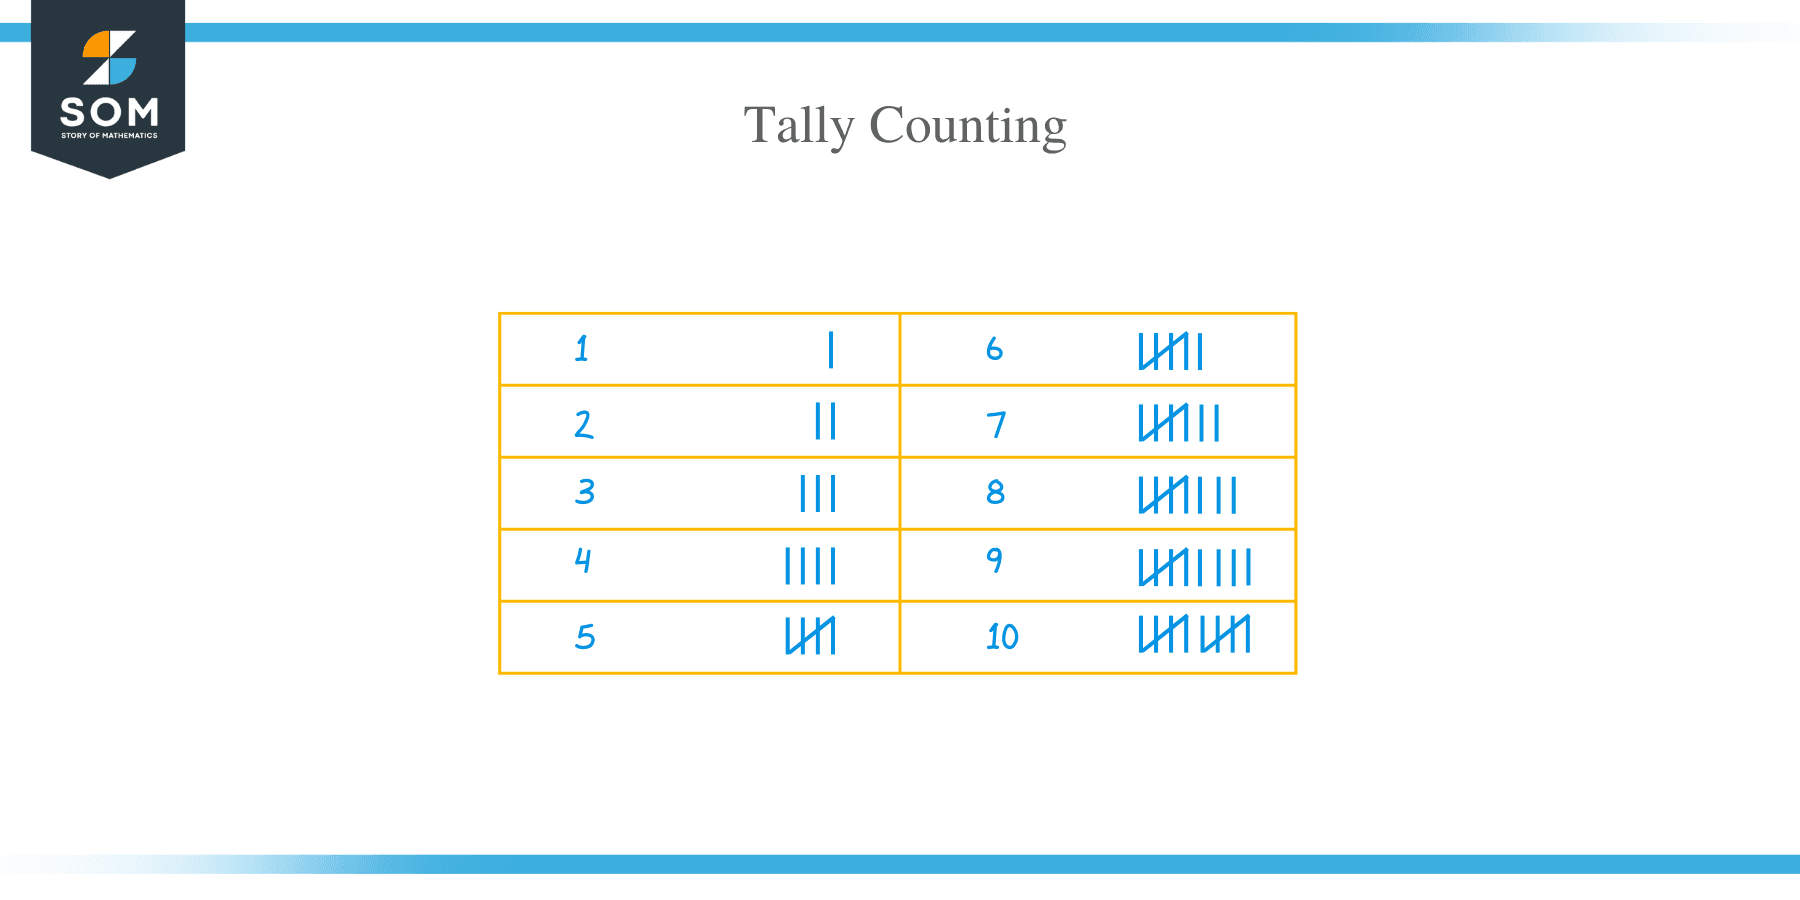
We use a tally chart to record and count the frequencies of our data. Each occurrence of any value or category is shown by a tally mark, and every fifth tally is drawn vertically to make a collection of five. The collections of 5 tallies are used to give the frequency.
How to make a tally chart?
- Each unique category or value is placed in the first column on the left).
- When any value occurs, a tally mark is added to the chart in front of the value or category name. Every fifth tally is drawn vertically to make a collection of five.
For example, the following is a tally chart of the smoking habits of 20 individuals.
Smoking habit | Tally |
Never smoker | ||||| |
Current smoker | |||| |
Former smoker < 1 year quitting | |||||| |
Former smoker >= 1 year quitting | || |
If we count these tallies and add a frequency column, we will have this table
Smoking habit | Tally | Frequency |
Never smoker | ||||| | 6 |
Current smoker | |||| | 5 |
Former smoker < 1 year quitting | |||||| | 7 |
Former smoker >= 1 year quitting | || | 2 |
We see from this chart that “Former smoker < 1 year quitting” is the most frequent category in these individuals with 7 occurrences. Also, “Former smoker >= 1 year quitting” is the least frequent category in these individuals with only 2 occurrences.
Another example, the following is a tally chart of the weights of 20 individuals.
Weight | Tally |
60 | || |
64 | |||| |
66 | |||||| |
67 | ||| |
68 | | |
70 | || |
If we count these tallies and add a frequency column, we will have this table
Weight | Tally | Frequency |
60 | || | 2 |
64 | |||| | 5 |
66 | |||||| | 7 |
67 | ||| | 3 |
68 | | | 1 |
70 | || | 2 |
Here, we see that the weight of 66 Kg is the most frequent in these individuals with 7 occurrences. The weight of 68 kg is the least occurring value with only 1 occurrence.
How to read a tally chart?
The tally chart is read by multiplying the bundles of tallies by 5 and adding the individual tallies to obtain the frequency of each value or category.
As an example, the following is a tally chart of the heights (in cm) of 300 individuals. We want to determine the frequency of each height.
Height | Tally |
175 | |||| |||| |||| |||| |||| |||| |
168 | |||| |||| |||| |||| |||| |||| |||| |||| |||| | |
151 | |||| |||| |||| |||| |||| |||| |||| |||| |||| |
153 | |||| |||| |||| |||| |||| |||| || |
150 | |||| |||| |||| |||| |||| |
176 | |||| |||| |||| |||| |||| |||| |||| |||| |
178 | |||| |||| |||| |||| |||| |||| || |
177 | |||| |||| |||| |||| | |
148 | |||| |||| |||| |||| |||| |||| |
To determine the frequency of the 175 cm height, there are 6 bundles of 5 tallies so the frequency = 6 X 5 = 30.
There are 9 bundles of 5 tallies for the 168 cm height and a single tally, so the frequency of 168 cm height = 9 X 5 = 45+1 = 46.
There are 9 bundles of 5 tallies for the 151 cm height, so the frequency of 151 cm height = 9 X 5 = 45.
There are 6 bundles of 5 tallies for the 153 cm height and two single tallies, so the frequency of 153 cm height = 6 X 5 = 30+2 = 32.
We can follow the same procedure for other heights to determine their frequency and produce the following table.
Height | Tally | Frequency |
175 | |||| |||| |||| |||| |||| |||| | 30 |
168 | |||| |||| |||| |||| |||| |||| |||| |||| |||| | | 46 |
151 | |||| |||| |||| |||| |||| |||| |||| |||| |||| | 45 |
153 | |||| |||| |||| |||| |||| |||| || | 32 |
150 | |||| |||| |||| |||| |||| | 25 |
176 | |||| |||| |||| |||| |||| |||| |||| |||| | 39 |
178 | |||| |||| |||| |||| |||| |||| || | 32 |
177 | |||| |||| |||| |||| | | 21 |
148 | |||| |||| |||| |||| |||| |||| | 30 |
We see that the most frequent height in these 300 individuals is 168 cm with 46 occurrences.
The role of a tally chart
By looking at the bundles of tallies, the tally chart gives us the most frequent value in our data. The most frequent value is known as the mode.
The mode is a type of summary statistics that gives important information about a certain data or population.
For the example of heights above, the most frequent value was 168 cm, so we know that 168 cm is the mode or the most frequent height among these 300 individuals.
In the other example of smoking habits, the tally chart tells us that “Former smoker < 1 year quitting” is the mode or the most frequent category among these 20 individuals.
The mode is not necessarily unique to a given data, since certain numbers or categories may occur the same maximum value. In that case, the data is called multimodal data as opposed to unimodal data with only one unique mode.
A common example of multimodal data when you have a mixed population. For example, if you have data of individual heights from a certain school, the data obtained, mostly, will be bimodal with one mode for students and the other mode for teachers.
Practical questions
1.The following is a tally chart for the names of 30 females.
Name | Tally |
Amalia | ||||||| |
Magdalena | ||| |
Alice | |||||| |
Kathryn | |||| |||| || |
What is the most frequent name? What is its frequency?
2.The following is a tally chart for the names of 40 males.
Name | Tally |
Marcus | |||| |||| |
Sterling | |||| |
Ernest | |||||| |
Smith | |||||||| |
Justin | ||| |
Lowell | |||| |
Cary | | |
What is the most frequent name? what is the least frequent name?
3.The following is a tally chart for the body mass index (BMI) of 20 individuals
BMI | Tally |
27.3 | || |
30.1 | |||| |
25.2 | | |
24.3 | |||||||| |
34.6 | ||| |
What is the most frequent value? Create a frequency distribution table for these numbers?
4.The following is a tally chart for the marital status of 50 individuals
Marital status | Tally |
Never married | |||| |||| ||| |
Separated | | |
Divorced | |||| |||| || |
Widowed | || |
Married | |||| |||| |||| |||| || |
What is the least frequent marital status? What is its frequency?
5.The following is a tally chart for the religion of 100 individuals
Religion | Tally |
Orthodox-Christian | |||| |
Catholic- Christian | |||| |||| |||| |||| | |
Protestant- Christian | |||| |||| |||| |||| |||| |||| |||| |||| |||| |
Buddhism | ||| |
Moslem | |||| |
Jewish | |||| | |
None | |||| |||| |||| |
What is the most frequent religion? What is the least frequent religion?
Answers
- The most frequent name is Kathryn. It has a frequency of 12 times.
- The most frequent name is Marcus. It occurs 10 times. The least frequent name is Cary which occurs only once.
- The most frequent BMI value is 24.3 with 9 occurrences. Here is the frequency table.
BMI | Tally | Frequency |
27.3 | || | 2 |
30.1 | |||| | 5 |
25.2 | | | 1 |
24.3 | |||||||| | 9 |
34.6 | ||| | 3 |
4.The least frequent marital status is “Separated” with only 1 occurrence.
5.The most frequent religion is “Protestant- Christian” with 45 occurrences. The least frequent religion is “Buddhism” with only 3 occurrences.
