JUMP TO TOPIC
Y MX B Calculator + Online Solver With Free Steps
The Y MX B Calculator plots a line and solves for its roots given the slope-intercept form or equation of a line y = mx + b. Here, m represents the slope of the line and b the y-intercept (where the line intersects the y-axis).
The calculator assumes the slope and intercept are already known. Otherwise, if you have a linear equation in two variables, you can re-arrange it to get the equation of a line. Then, you just need to compare the re-arranged form with the standard form to get the values m and b.

What Is the Y MX B Calculator?
The Y MX B Calculator is an online tool that uses the slope-intercept form or equation of a line to calculate various properties of that line and plot it on a 2D graph.
The calculator interface consists of two text boxes side-by-side. The first one on the left takes the value of the y-intercept b, and the second box on the right takes the value of the slope m.
If you do not have the values of the slope and the y-intercept, you can get them from the slope-intercept form of a line. Consider the equation:
y = 3x + 2
This equation is already in the slope-intercept form. Now compare it with the general slope-intercept form of a line:
y = mx + b
Then, in this case:
slope = m = 3, y-intercept = b = 2
If your equation can be re-arranged into this form, it represents a line, and you can use the calculator!
How To Use the Y MX B Calculator?
You can use the Y MX B Calculator to plot and find the properties of a line by entering the values of the slope and y-intercept. For example, suppose you want to plot a line with slope m = 1.53 and b = 6.17. You can use the calculator for this by following the step-by-step guidelines below.
Step 1
Ensure the values for slope and y-intercept do not contain any variables. Otherwise, the shape you are dealing with is probably not a line, and the calculator will not display the plot either.
Step 2
Enter the value of the y-intercept b into the first text box on the left. In our example’s case, you would type “1.53” without the quotes.
Step 3
Enter the value of the slope m into the second text box on the right. For this example, you would enter “6.17” without quotes.
Step 4
Press the Submit button to get the results.
Results
The results span multiple sections, but the most important ones are the “Plot” and “Root” sections. The former shows the 2D plot of the line and the latter contains the root of the line equation.
Note that this root is essentially the x-intercept of the line – that is, the value of x where y = 0, or visually, the line intersects the x-axis.
There are a few other sections that might be useful:
- Input: This section contains the input values of the slope and y-intercept plugged into the slope-intercept form of a line for manual verification.
- Geometric figure: The type of figure created by the provided values. If all is well, this should say “line.”
- Properties: This contains the properties of the line as a real function over the variable x. These include the domain, range, and specific properties such as bijectivity.
- Partial derivatives: The partial derivatives of the line equation over x and y, although in the standard form, only the derivative w.r.t. x matters.
- Alternate forms: These are rearranged versions of the slope-intercept line equation.
For our mock example above, the results are:
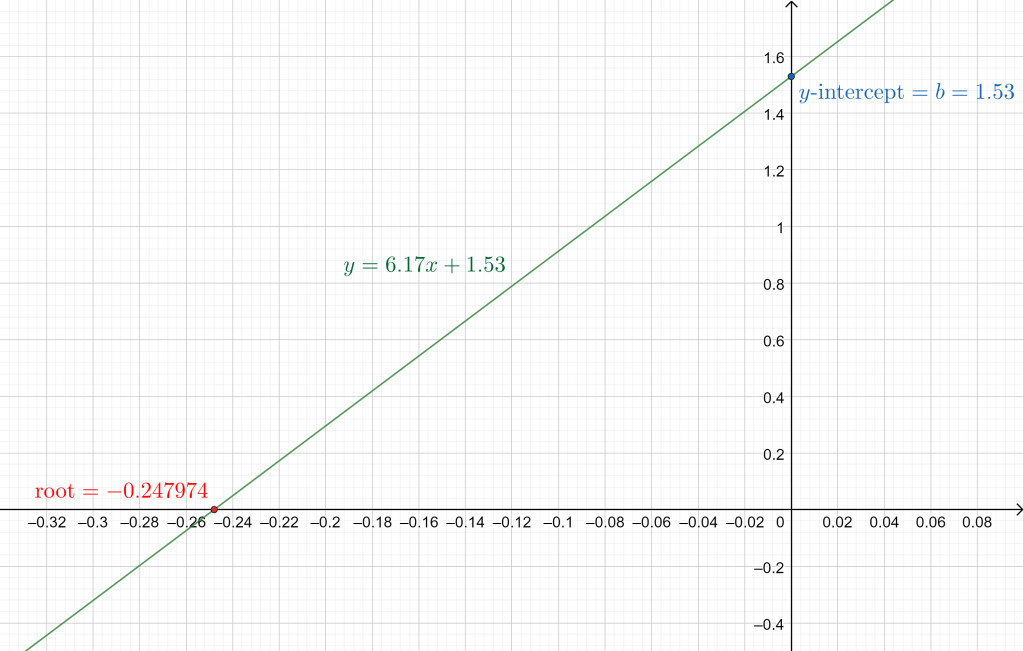
Input: y = 6.17x + 1.53
Geometric figure: line
Root: -0.247974
Properties: Domain $\mathbb{R}$, Range $\mathbb{R}$, bijective
Partial derivatives:
$\displaystyle \frac{\partial}{\partial x}$(6.17x + 1.53) = 6.17
$\displaystyle \frac{\partial}{\partial y}$(6.17x + 1.53) = 0
And the plot is given below:

Figure 1
How Does the Y MX B Calculator Work?
The Y MX B Calculator works by plugging the input values for slope m and y-intercept b into the following equation: y = mx + b.
The above equation is the slope-intercept form of a line in two dimensions. The calculator then finds the root of the equation (essentially the x-intercept of the line) by setting y = 0 and solving for x. Finally, it plots it over a range of values for x.
Slope
The slope or gradient of a 2D line joining two points, or equivalently two points on a line, is the ratio of the difference between their y (vertical) and x (horizontal) coordinates. Thus, the slope represents the sharpness of the rise or fall of the line (y values) compared to the x values.
In other words, a line with a large slope will rise sharply – meaning that, for points on the line, the y component changes much more rapidly than the x component (the line has a large incline).
Similarly, for a line with a small slope, the y component changes much more slowly than the x component (the line has a slight incline).
Sometimes, the definition is shortened to “the ratio of the rise over the run” or just “rise over run,” where “rise” is the difference in the vertical coordinate and “run” is the difference in the horizontal coordinate.
\[ m = \frac{\text{vertical change}}{\text{horizontal change}} = \frac{\text{rise}}{\text{run}} = \frac{y_2-y_1}{x_2-x_1} = \frac{\Delta y}{\Delta x} \]
Note that the slope-intercept representation of a line cannot represent completely vertical lines as their slope is $\infty$ and consequently undefined. You should use the polar form representation in those cases.
Intercept
The intercept is a term used to indicate the intersection of a line with one of the coordinate axes. In 2D Cartesian coordinates, these are the x and y-axes, and the corresponding intersections of the line are the x and y-intercept.
Note that the x-intercept is simply the root of the equation representing the line. The y-intercept represents the offset of the line from the origin point. If it is 0, then the line passes through the origin.
The minimum requirements to get the equation of a line are any two points along that line. You can then solve for the slope and intercept yourself (see Example 3).
In other cases, if you have a linear equation in two variables, you can rearrange it to get the slope-intercept form and get the required values from there (see Example 2).
Solved Examples
Example 1
Given that a line has a slope of 2 and intersects the y-axis at y = 5, find its slope-intercept form, root(s), and plot it.
Solution
Given that slope m = 2 and y-intercept b = 5, we simply substitute these values into the standard equation of a line y = mx + b to get the slope-intercept form:
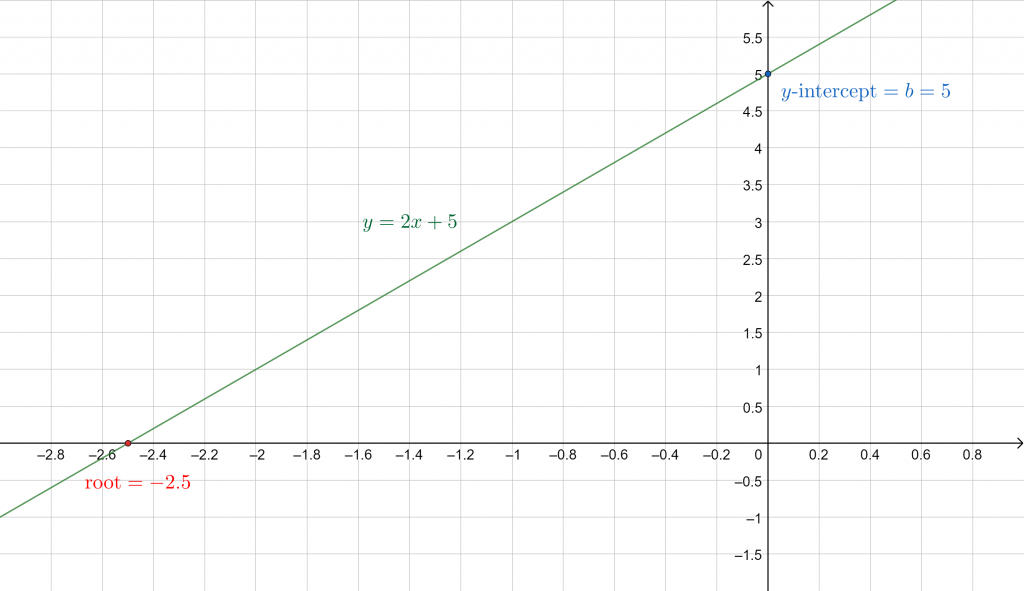
y = 2x + 5
If we now put y = 0, we can solve for x to get the root of the equation. Since this is a line, it will only intersect the x-axis at one point and have only one root:
2x + 5 = 0
2x = -5
x = -2.5
And plotting this over a range of values of x, we get:

Figure 2
Example 2
Solve the following equation for y in terms of x.
\[ \sqrt{5x+3y}-3 = 0 \]
Solution
Isolating the radicals:
\[ \sqrt{5x+3y} = 3 \]
Squaring both sides of the equation:
\[ 5x+3y = 3^2 = 9 \]
Putting all terms on one side:
\[ 5x+3y-9 = 0 \]
It is the equation of a line! Rearranging:
\[ 3y = -5x+9 \]
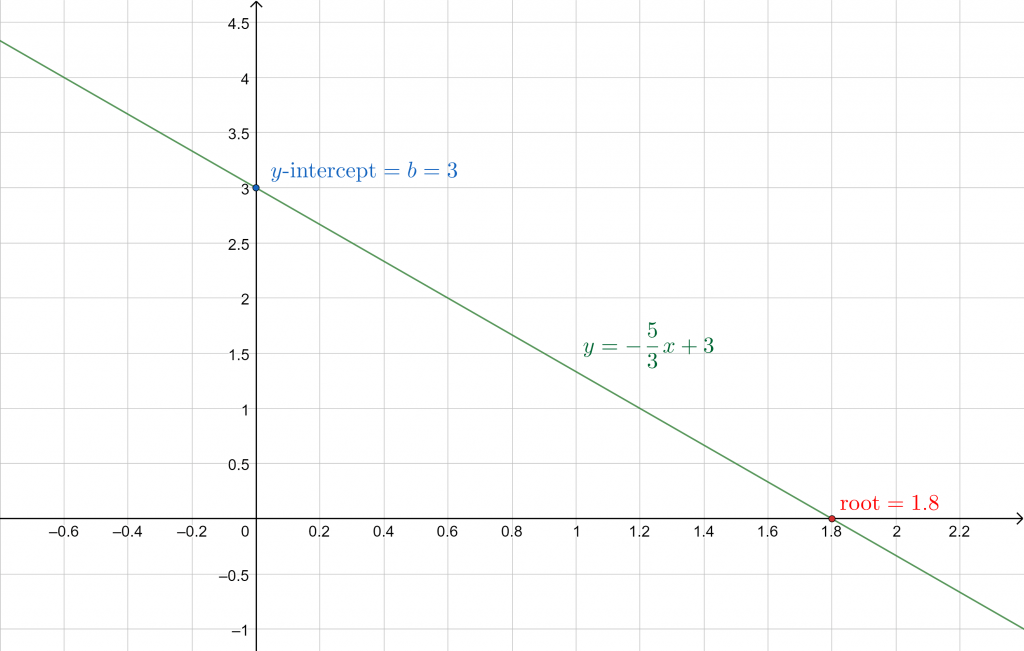
\[ y = -\frac{5}{3}x + 3 \]
The y-intercept of this line is b = 3, and slope m = -5/3. Setting y = 0, we get the root:
\[ -\frac{5}{3}x + 3 = 0 \, \Rightarrow \, x = \frac{9}{5} \]
x = 1.8
Let us plot this:

Figure 3
Example 3
Consider two points p = (10, 5) and q = (-31, 19). Find the equation of the line joining them and plot it.
Solution
Let px = 10, py = 5, qx = -31, and qy = 19. Then we can get the slope from the formula:
\[ m = \frac{py – qy}{px – qx} = \frac{5 – 19}{10 – (-31)} \]
\[ m = -\frac{14}{41} \approx -0.341463 \]
Given that p and q are points on the line, we can pick one and the calculated slope value to get the y-intercept value. Let us go with p. Then, putting m = -0.341463, x = px = 10 and y = py = 5 in the equation below:
y = mx + b
b = y – mx
b = 5 – (-0.341463)(10)
b = 5 + 3.41463 = 8.41463
Now that we have both the slope and y-intercept, we can write our line equation as:
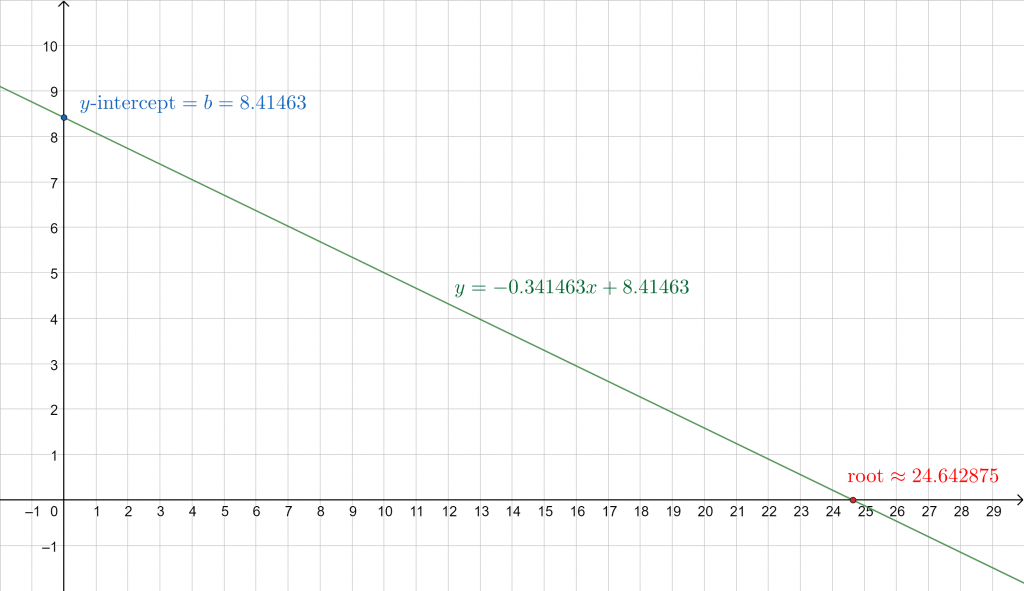
y = -0.341463x + 8.41463
And the roots are at y = 0:
-0.341463x + 8.41463 = 0
x $\boldsymbol{\approx}$ 24.642875
Let us further confirm that the point q lies on this line by putting x = qx = -31 and y = qy = 19 in the line equation:
19 = -0.341463(-31) + 8.41463
19 = 10.585353 + 8.41463
19 $\approx$ 18.999983
The slight error above is due to rounding. The line’s plot:

Figure 4
All graphs/images were created with GeoGebra.
