JUMP TO TOPIC
Graph Polar Equations Calculator + Online Solver With Free Steps
The Graph Polar Equations Calculator is a tool used to plot a point in the polar coordinate system. In the Polar Coordinate System, the point is represented in the form of a radius and angle from the origin.
The calculator gives the polar graph of the given point along with the arc length of the polar curve.

What Is a Graph Polar Equations Calculator?
The Graph Polar Equations Calculator is an online calculator that can be used to draw the polar graph of a polar equation, whereas plotting it manually is a difficult task.
This online calculator is available in the browser, so you don’t need to install or download any specific application. All this tool requires is simply the polar components and it will give you a detailed representation of the point in the polar coordinate system.
The Polar Coordinate has two dimensions. The first is the radius, which is the distance of the point from the origin, and the second is the angle, which is the direction of the point concerning the origin.
So to represent a point in the polar coordinate system by hand, you need these two components. Besides this, one must have a good understanding of polar graphs and the representation of the algebraic functions in the system.
As the equations become complex, it is a difficult and time-intensive task to determine the polar representation. It is the tool that will help you to determine the polar graph of your desired equation in just a single click.
How To Use the Graph Polar Equations Calculator?
You can use Graph Polar Equations Calculator by inserting the polar components including radius and angle $\theta$ to get the results.
It is the simplest online tool for getting polar graphs and here’s how to use this magical tool. You first need a radius equation and range of angle. Then you must follow the below-mentioned steps to get accurate results.
Step 1
Insert the radius equation which is the function of angle ($\theta$) in the box titled R. It is the first polar component of the point that describes the distance from the origin.
Step 2
Now enter the starting and ending point of the angle in the Theta From and To boxes, respectively. This range specifies the area in which you want to draw the polar graph.
Step 3
Finally, press the Plot button and it will show the desired results. It will display the polar graph of the given point. In addition to that, it will also display the arc length of the polar curve obtained.
To calculate arc length, it uses the following formula:
\[Arc Length = \int_{a}^b \sqrt{(r)^2 + (\dfrac{dr}{d\theta})^2} d\theta \]
Solved Examples
Here are some examples solved by using the Polar Graph Equations Calculator.
Example 1
Consider the following radius equation:
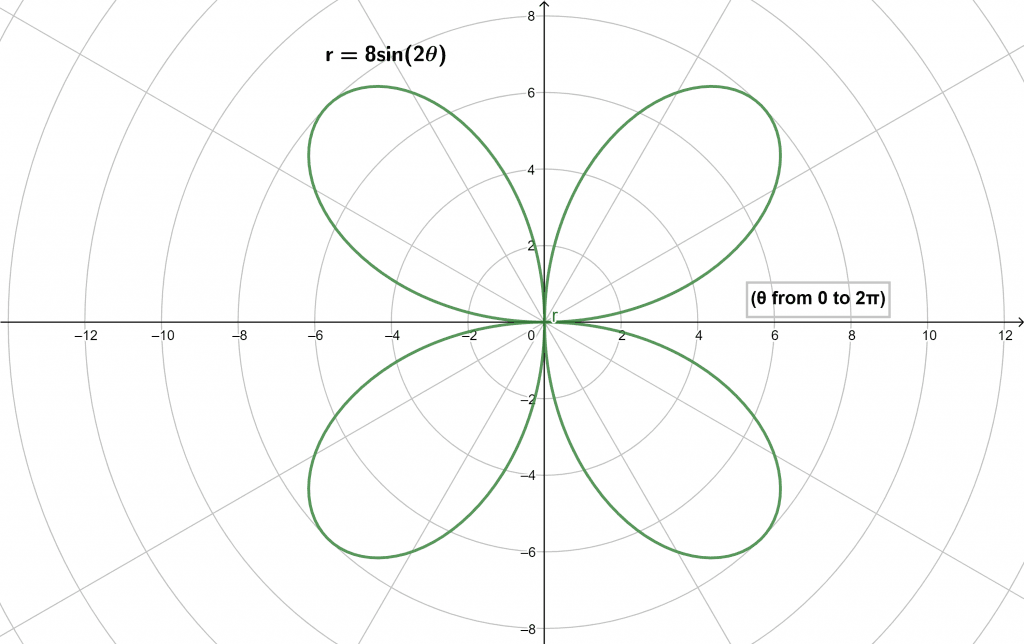
\[ r = 8 \sin(2\theta) \]
The range of angles for this function is given as:
\[ \theta = (0,2\pi) \]
Draw the polar representation.
Solution
After putting the above elements, the following results are obtained.
Polar Graph:
A Polar Graph for a given coordinate is shown below in Figure 1.

Figure 1
Arc Length of the Polar Curve:
Now the arc length for above curve is written below:
\[ \int_{0}^{2\pi} 4\sqrt{10+6\cos({4\theta})} d\theta \approx 77.5076 \]
Example 2
Let the below mentioned equation be our radius equation:
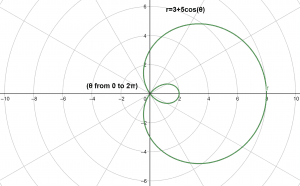
\[ r = 3 + 5\cos(\theta) \]
Where angle limits for this equation are as follow:
\[ \theta = (0,2\pi) \]
Find the Polar Graph for the given equation.
Solution
Insert both polar components.
The results are demonstrated below:
Polar Plot:
The polar plot for this equation is illustrated in Figure 2.

Figure 2
Arc Length of the Polar Curve:
Arc length for the same equation is given as:
\[ \int_{0}^{2\pi} \sqrt{34+30\cos{\theta}}d\theta \approx 34.3136 \]
All the Mathematical Images/Graphs are created using GeoGebra.
