JUMP TO TOPIC
Circle Graph Calculator + Online Solver With Free Easy Steps
The online Circle Graph Calculator allows you to plot a circle using the general equation of a circle.
The Circle Graph Calculator is an easy-to-use calculator that mathematicians and scientists widely use to graph circles.

What Is a Circle Graph Calculator?
The Circle Graph Calculator is an online tool that allows you to graph a circle using its equation.
The Circle Graph Calculator requires three inputs, the circle general equation’s C, D, and E values. After providing the values to your calculator, you only need to click on the “Submit” button.
How To Use a Circle Graph Calculator?
You can use the Circle Graph Calculator by simply entering the circle’s values into their respective boxes and clicking the “Submit” button.
The detailed step-by-step instructions on how to use the Circle Graph Calculator are given below:
Step 1
Firstly, you enter the value of C into the Circle Graph Calculator.
Step 2
After adding the value of C, you add the value of D into the Circle Graph Calculator.
Step 3
Once you have inputted the C and D values, you add the final E value into the Circle Graph Calculator.
Step 4
Finally, once you have inputted all the values in the calculator, you click on the “Submit” button on the Circle Graph Calculator. The calculator will then generate a graph using the general circle equation and display it in another window.
How Does a Circle Graph Calculator Work?
The Circle Graph Calculator works by taking the values of the general circle equation as inputs and graphing a circle according to the circle’s equation. The general equation for a circle is represented as shown below:
Circle General Form Equation : $x^{2}$ + $y^{2}$ + Cx + Dy + E = 0
Radius of a Circle
The radius is defined in geometry as a line segment from the center of a circle or sphere to its perimeter or boundary. It is a crucial component of spheres and circles and is frequently abbreviated as r.
The diameter of a circle or sphere is the most extended line segment connecting all points on the opposite side of the center, and the radius is equal to half of the diameter in length. It can be written as $\frac{d}{2}$, where d is the circle’s or sphere’s diameter.
The radius of a circle can be calculated by using any of the following formulas:
\[ r = \frac{d}{2} \]
\[ r = \frac{Circumference}{2 \pi} \]
\[ r = \sqrt{\frac{Area}{\pi}} \]
Radius plays a crucial role in calculating the equation of a circle.
Equation of a Circle
The equation of a circle is an algebraic way to explain a circle, given a circle’s radius and center. The formulas used to determine a circle’s area or circumference differ from a circle’s equation. Numerous coordinate geometry problems involving circles employ this equation.
An equation of a circle depicts a circle’s position in the Cartesian plane. We can write the equation for a circle if we know the location of the circle’s center and how long its radius is. All of the points on the circle’s circumference are represented by the circle equation.
The cluster of points whose distance from a given point is a constant value is represented by a circle. The circle’s radius r is a constant for this fixed point, known as the circle’s center.
For a circle with a center at (x,y) and a radius of r, the standard equation is as follows:
\[ (x-x_{1})^{2} + (y-y_{1})^{2} = r^{2} \]
With the help of the equation for a circle, we may draw a circle on the cartesian plane once we have determined the location of the circle’s center and radius. There are several forms of how the equation of a circle is represented.
What Is the General Equation of a Circle?
The general equation of a circle can be written as:
Circle General Form Equation : $x^{2}$ + $y^{2}$ + Cx + Dy + E = 0
The coordinates of the circle’s center and radius are found using this general form, where C, D, and E are constants.
The general form of the equation of a circle makes it difficult to identify any significant properties about any specific circle, in contrast to the standard form, which is simpler to comprehend.
Standard Equation of a Circle
The standard circle equation provides exact information on the circle’s center and radius. As a result, reading the circle’s center and radius at a glance is much easier. The standard equation of a circle is with center at (x,y) is $ (x-x_{1})^{2} + (y-y_{1})^{2} = r^{2} $ , where (x,y) is a point on the circumference of the circle.
How To Derive the Equation of a Circle?
The equation of a circle can be derived by using the arbitrary point on the circumference of the circle, (x1, y1), the circles center (x,y), and the radius r. The circle’s radius is the distance between this point and the center. We use the following equation to calculate the distance:
\[ \sqrt{(x-x_{1})^{2} + (y-y_{1})^{2} }= r \]
We can now square both sides of the equation and get the following equation:
\[ (x-x_{1})^{2} + (y-y_{1})^{2} = r^{2} \]
This is how we derive the equation of a circle.
Solved Examples
The Circle Graph Calculator can instantly plot a circle graph using only the circle’s general equation.
Here are some examples solved using the Circle Graph Calculator.
Example 1
While working on an assignment, a high school student comes across the following equation:
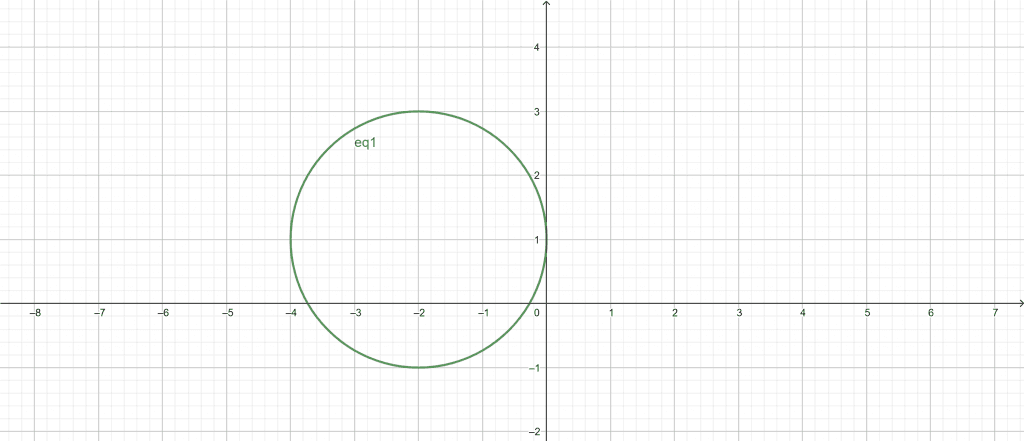
$x^{2}$ + $y^{2}$ + 4x – 2y + 1 = 0
To complete his assignment, the student must graph the circle using the equation.
Using the Circle Graph Calculator, plot the graph of a circle according to the equations given.
Solution
The Circle Graph Calculator can quickly solve this equation. First, we need to enter the C value of our equation into the Circle Graph Calculator; the C value here is 4. After entering the C value, we input the D constant into the calculator, -2. Finally, we plug the E value in its respective box, which is 1 in our case.
Once we have inputted all the values in the Circle Graph Calculator, we click the “Submit” button. This creates opens a new window where the circle graph has been plotted.
Below are the results generated from the Circle Graph Calculator:
Input Interpretation:
$x^{2}$ + $y^{2}$ + 4x – 2y + 1 = 0
Implicit Plot:

Figure 1
Example 2
During his research, a mathematician comes across the following circle equation:
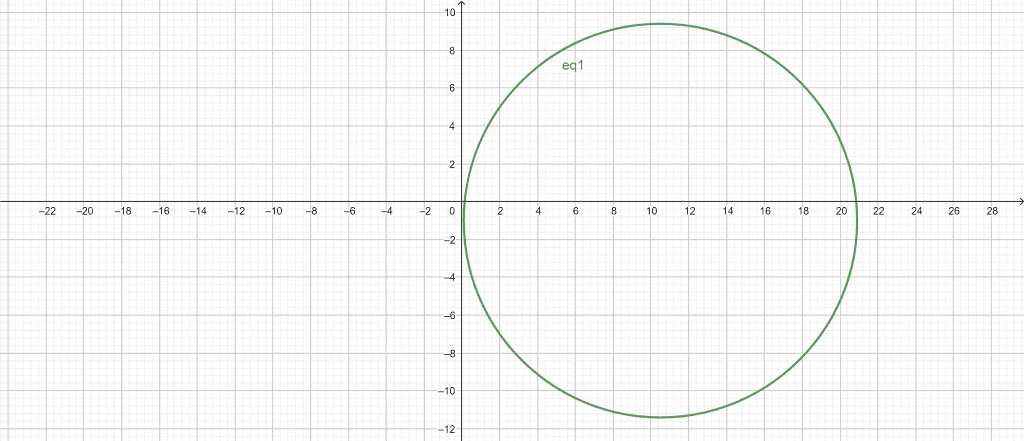
Circle General Form Equation : $x^{2}$ + $y^{2}$ – 21x + 2y + 3 = 0
The mathematician needs to plot this equation to complete his research.
Use the general form equation of the circle to plot the circle.
Solution
We use the Circle Graph Calculator to graph the circle equation instantly. In the first step, we input the C constant into our Circle Graph Calculator; the value of C is -21. After adding our C value, we add the D constant in the calculator; the value of D is 2. In the end, we enter the constant value E in the Circle Graph Calculator; the value of E is 3.
After adding all the constant values in our Circle Graph Calculator, we click the “Submit” button. The Circle Graph Calculator quickly plots the graph using the equation and displays it in a new window.
The following results are displayed using the Circle Graph Calculator:
Input interpretation:
Circle General Form Equation : $x^{2}$ + $y^{2}$ – 21x + 2y + 3 = 0
Implicit plot:

Figure 2
Example 3
A college student needs to graph a circle equation which is part of his final term exam. Here is the circle equation:
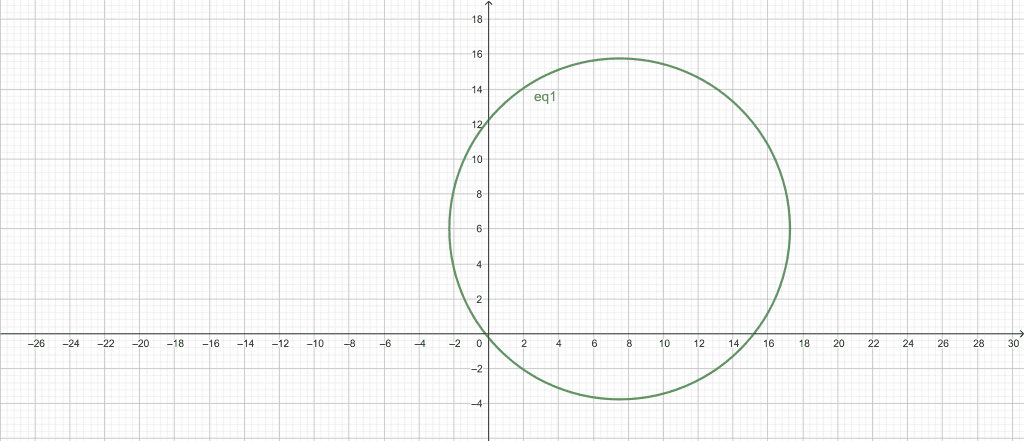
Circle General Form Equation : $x^{2}$ + $y^{2}$ – 15x – 12y – 3 = 0
Use the Circle Graph Calculator to plot the equation given.
Solution
The Circle Graph Calculator allows us to solve the equation and plot a graph easily. First, we plug our constant value C into the Circle Graph Calculator; the value of C is -15. After entering the value of C, we add the constant value of D in our calculator; the value of D is -12. Next, we plug our final constant value E into the Circle Graph Calculator; the value of D is -3.
Finally, after entering all the input values in our Circle Graph Calculator, we click the “Submit” button. The calculator instantly plots a graph of the equation in a new window.
The following results are extracted from the Circle Graph Calculator:
Input Interpretation:
Circle General Form Equation : $x^{2}$ + $y^{2}$ – 15x – 12y – 3 = 0
Implicit Plot:

Figure 3
Example 4
Consider the following equation of a circle:
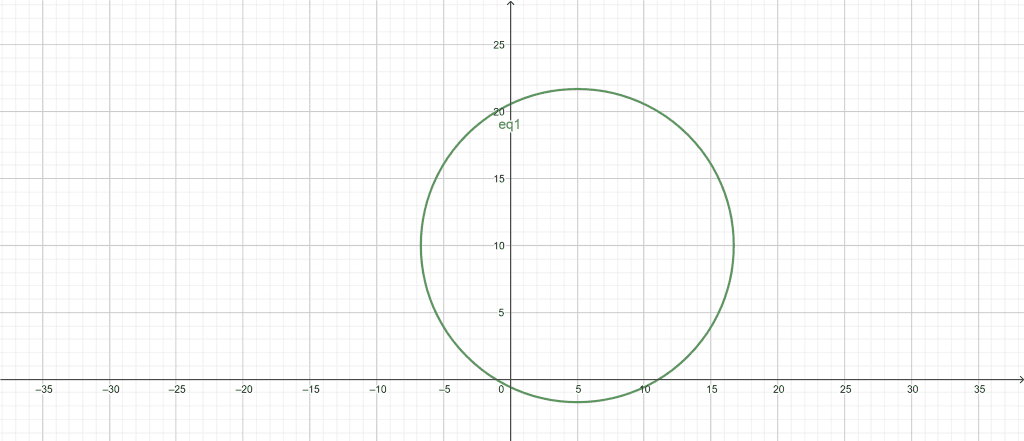
Circle General Form Equation : $x^{2}$ + $y^{2}$ + 10x – 20y – 12 = 0
Use the Circle Graph Calculator to plot a graph for the equations above.
Solution
Using the Circle Graph Calculator, we can plot the graph of the equation. We enter the input constant values C, D, and E into the Circle Graph Calculator; the values of C, D, and E are 10, -20, and -12.
After adding the input values to our calculator, we click the “Submit” button. This plots a graph according to the circle’s equation.
The following are the results calculated using the Circle Graph Calculator:
Input Interpretation:
Circle General Form Equation : $x^{2}$ + $y^{2}$ + 10x – 20y – 12 = 0
Implicit Plot:

Figure 4
All images/graphs are made using GeoGebra.
