
$(a) \space x=t^4 -t+1 , y= t^2$
$(b) \space x=t^2 -2t , y=\sqrt t$
$(c) \space\ x=\sin2t ,y=\sin ( t +\sin 2t)$
$(d) \space x=\cos5t ,y=\sin 2t$
$(e) \space x=t+\sin4t ,y= t^2 +\cos3t$
$(f) \space x=\dfrac{\sin2t }{4+t^2} ,y=\dfrac{\cos2t} {4+t^2}$
Graph I
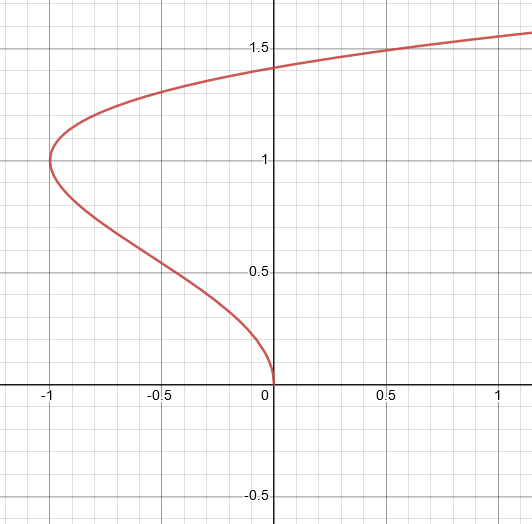
Graph II
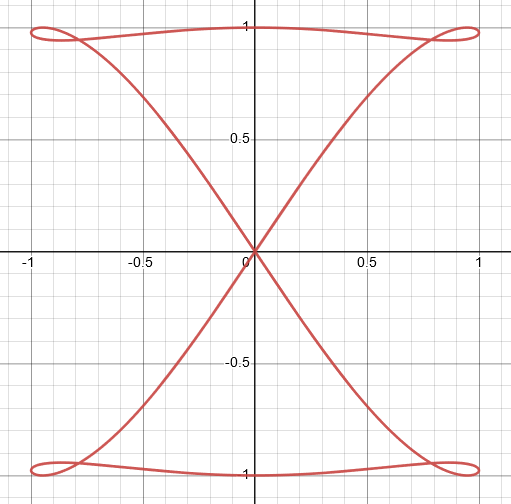
Graph III
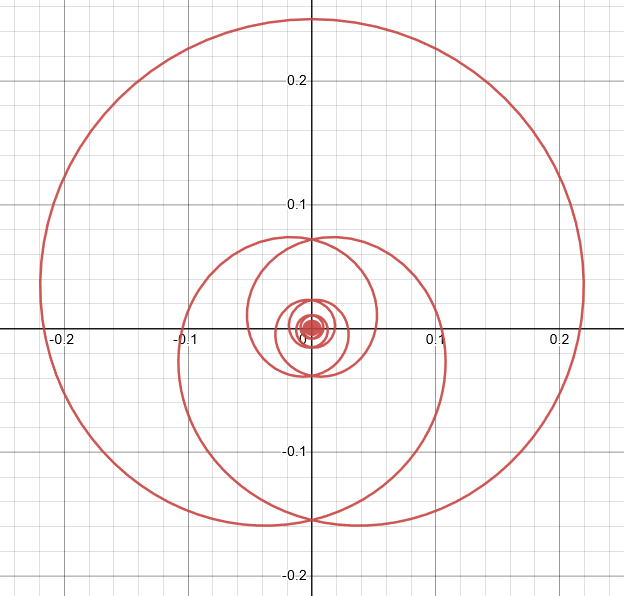
Graph IV
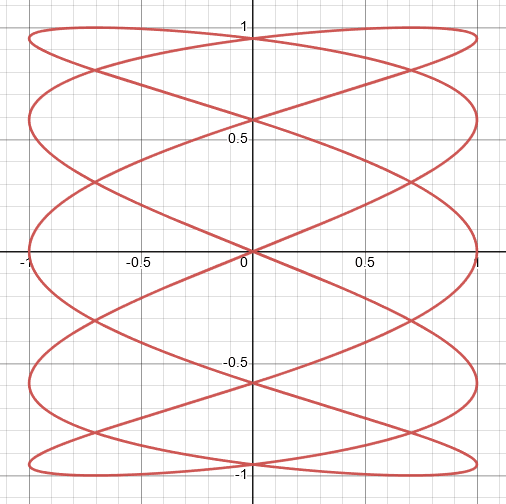
Graph V
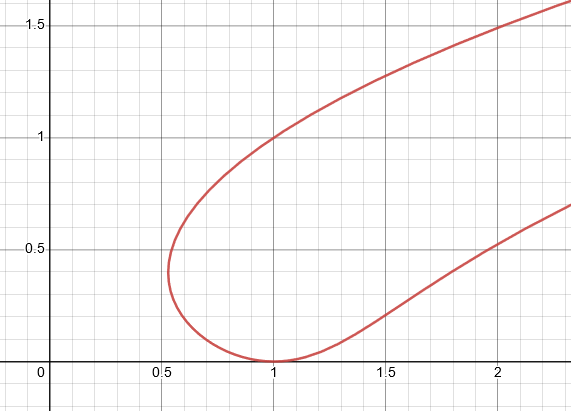
Graph VI
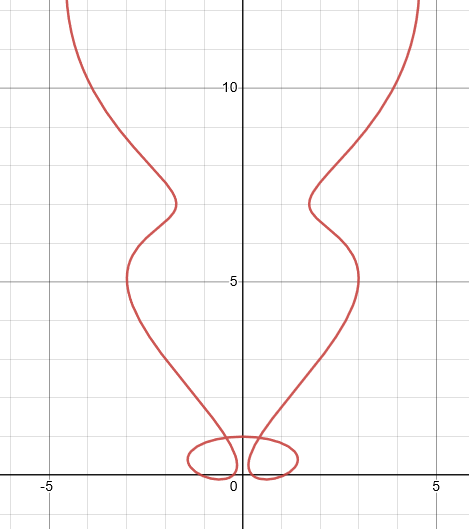
In this question, we have to match the given functions with the given graphs labeled from I to VI. For this, we have to recall our fundamental knowledge of Calculus for the most suitable match of the functions with the given graphs.
This question uses the basic concepts of Calculus and Linear Algebra by matching the functions to the best graphs.
Expert Answer
$(a) \space x=t^4 -t+1 , y= t^2$:
For the given parametric equation, suppose the value of $t$ is equal to zero, then we have the function equal to:
\[x=(0)^4 -0+1\ ,\ y= (0)^2\]
\[ x= 1 , y= 0\]
When the value of $t$ is zero then $x=1$ and $y=0$, there is no other graph with starts at $x=1$. So, for this equation, the best graph is labeled $V$.

Graph V
$(b) \space x= t^2 -2t , y= \sqrt t$
For the given parametric equation, suppose the value of $t$ is equal to zero, then we have the function equal to:
\[x=(0)^2 -2t\ ,\ y= \sqrt (0)\]
\[x= 0 , y= 0\]
When the value of $t$ is zero, then $x=0$ and $y=0$. There is no other graph with starts at $x=0$ and both the coordinate values go to infinity, so for this equation, the best graph is labeled $I$.

Graph I
$(c) \space\ x= \sin2t ,y= \sin ( t +\sin 2t)$
For the given parametric equation, when the value of $t$ is zero, then $x=0$ and $y=0$. There is no other graph that has the value of $(0,1)$, which is at $t=\dfrac{\pi}{2}$. So, for this equation, the best graph is labeled $II$.

Graph II
$(d) \space x= \cos5t ,y= \sin 2t $
For the given parametric equation, when the value of $t$ is zero, then $x=1$ and $y=0$. There is no other graph that has the value of $(0,1)$ which is at $t=0$. So, for this equation, the best graph is labeled $IV$.

Graph IV
$(e) \space x= t+ \sin 4t ,y= t^2 +\cos3t $
For the given parametric equation, the value of both coordinates $x$ and $y$ goes to infinity. There is no other graph that also shows the oscillatory behavior. So, the best graph is labeled $VI$.

Graph VI
$(f)\ x= \dfrac{\sin 2 t }{4 + t^2} ,y= \dfrac { \cos2 t} {4+ t^2 }$
For the given parametric equation, the value of both coordinates $x$ and $y$ cannot be $(0,0)$ but with the oscillatory behavior. So the best graph is labeled $III$.

Graph III
Numerical Result
By assuming the values of $x$ and $y$, functions are matched with the best graphs.
Example
Draw the graph for function $(x,y)=(\sin t-7t,\ \sin\ 2t)$.
Put $t=0$ , $t=\dfrac{\pi}{2}$
The graph for the given function is as follows:
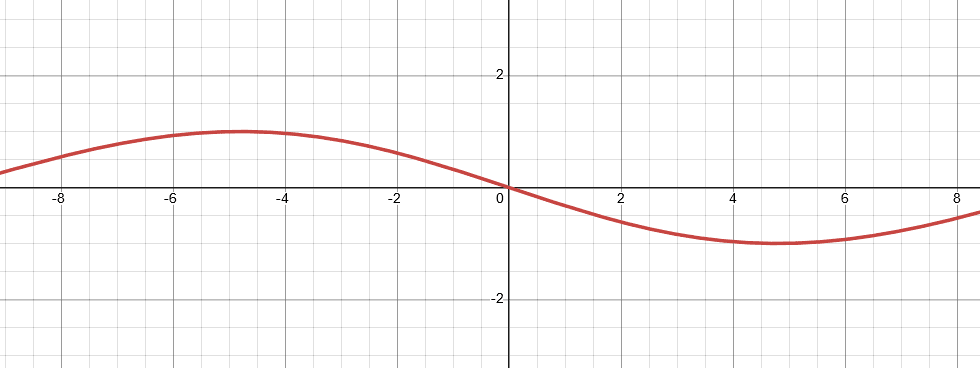
Figure I
Images/Mathematical drawings are created with Geogebra.
