- Home
- >
- Greatest Integer Function – Explanation & Examples
JUMP TO TOPIC
Greatest Integer Function – Explanation & Examples
 When studying graphs and functions, you’ll be introduced to a unique function called the greatest integer function. Here’s a quick recall of the greatest integer functions’ definition:
Greatest integer functions (or step functions) return the rounded-down integer value of a given number.
If you’ve seen it in your previous lessons or in your textbooks, have you ever wondered why these functions are called step functions? The answer to that question is found in this article. We’ll learn about this function’s definition, properties, and graph.
What is the greatest integer function?
The greatest integer function is a function that returns a constant value for each specific interval. These functions are normally represented by an open and closed bracket, [ ]. These values are the rounded-down integer values of the expression found inside the brackets. Below are some examples of the greatest integer functions:
- $f(x) = [ -5.678]$
- $g(x) = [-x + 1]$
- $h(x) = [-4x2 – 5]$
When the expression inside the brackets is just a constant, we’ll be finding the number’s greatest integer value.
How to find the greatest integer value?
Let’s first understand how we can find the greatest integer value of a given number. Here are two rules to remember when finding the greatest integer values:
- If the number inside the brackets is not an integer, we return the smaller integer close to the given number.
- For example, if we have $f(x) = [-15.698]$, the two closest integers are $-16$ and $-15$. For the greatest integer values, we always choose the smaller integer. This means that $[-15.698] = -16$.

- If the number inside the brackets is an integer, we return the original number.
- This means that if we have $g(x) = [48]$, the greatest integer value is equal to $48$.
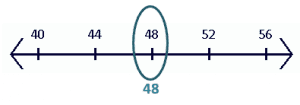
Here are some more examples of the greatest integer values:
| $\boldsymbol{x}$ | $\boldsymbol{y = [x]}$ |
| $-5$ | $-5$ |
| $-12.45$ | $-13$ |
| $-30.01$ | $-31$ |
| $32.067$ | $32$ |
| $49.999$ | $49$ |
Once we master our skills in finding the greatest integer values, we can then use this to graph the greatest integer functions. In the section of this article, we’ll learn why this function is also called a step function.
How to graph greatest integer function?
It’s time for us to learn how the greatest integer function is presented on a $xy$-coordinate system. We apply the same process when graphing any other functions:
- Construct a table of values that satisfies the conditions of the function.
- Plot these points on the graph.
- Connect the points with a line or a curve to construct the function.
But what makes the greatest integer function or step function unique? We are working with intervals and endpoints as open and closed points.
- Each interval will have a shaded point on the smaller integer and an unfilled dot on the bigger integer.
- These will then each be connected by vertical lines.
- The same process will be applied for each interval.
Let’s work on graphing $f(x) = [x]$ first and we can do this by first creating a table of values.
| $\boldsymbol{x}$ | $\boldsymbol{y = [x]}$ | Closed Dot | Open Dot |
| $[-3, -2)$ | $-3$ | $(-3, -3)$ | $(-2, -3)$ |
| $[-2, -1)$ | $-2$ | $(-2, -2)$ | $(-1, -2)$ |
| $[-1, 0)$ | $-1$ | $(-1, -1)$ | $(0, -1)$ |
| $[0, 1)$ | $0$ | $(0, 0)$ | $(1, 0)$ |
| $[1, 2)$ | $1$ | $(1, 1)$ | $(2, 1)$ |
| $[2, 3)$ | $2$ | $(2, 2)$ | $(3, 2)$ |
| $[3, 4)$ | $3$ | $(3, 3)$ | $(4, 3)$ |
Now that we have the values for each interval, we can plot each open and closed dot. Connect each pair of dots by a line afterward. Below is how the interval, $[0, 1)$, will be plotted: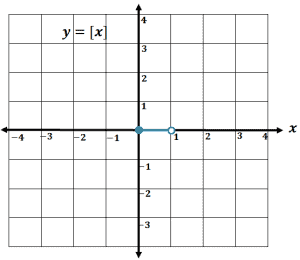
Do the same for the rest of the intervals and you’ll be able to come up with the graph shown below.
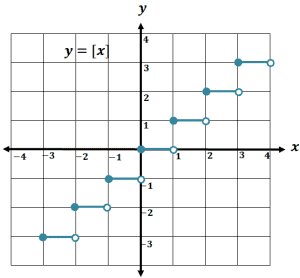
As you can see, the graph above looks like a step of a staircase, and hence, its name: step function. We can also apply the same technique when graphing for different step functions.
How to translate $\boldsymbol{f(x) = [x]}$?
We’ve now learned how we can graph $f(x) = [x]$. To save time and also practice our knowledge on graphing functions, we can also graph step functions by translating $f(x) = [x]$.
- If the step function is of the form, $f(x) = [x – h]$ or $f(x) = [x + h]$, translate the graph of $y = [x]$ by $h$ units to the left or right.
- If the step function is of the form, $f(x) = [x] + k$ or $f(x) = [x] – k$, translate the graph of $y = [x]$ by $k$ units upward or downward, respectively.
- If the step function is of the form, $f(x) = b[x]$ or $f(x) = \dfrac{1}{b[x]}$, vertically shrink or stretch the graph of $y = [x]$ by a factor of $b$.
- If the step function is of the form, $f(x) = [bx]$ or $f(x) = \left[\dfrac{x}{b}\right]$, horizontally shrink or stretch the graph of $y = [x]$ by a factor of $b$.
- If the step function has a negative coefficient, reflect $y = [x]$ over the $x$-axis.
You can also graph step functions by constructing a table of values, but knowing these translations can help check the graph we constructed as well.
Summary of the greatest integer function definition
We’ve now learned about the greatest integer function and that includes its fundamental definition, properties, and even its graph.
We can now start working on more complex problems in the next section, but before we do so, let’s summarize what we’ve learned so far:
- The greatest integer functions (or step functions) can help us find the smaller integer value close to a given number.
- The step function’s graph can be determined by finding the values of $y$ at certain intervals of $x$.
- The greatest integer functions’ graph looks like a step of a staircase.
- We can translate the graph of $f(x) = [x]$ to graph other functions.
Example 1
Find the greatest integer values of the following:
a. $[-12.01]$
b. $[45.99]$
c. $[-54]$
d. $\left[12 \dfrac{3}{4} \right]$
Solution
a. Since $-12.01$ is a negative decimal number, we find the smaller integer between $-13$ and $-12$. Using the number line as a guide, we can see that the smaller integer is $-13$.

b. Since $45.99$ is a positive decimal number, we find the smaller integer between $45 $and $46$. Using the number line as a guide, we can see that the smaller integer is $45$.

c. Since $-54$ is a negative integer, we select the integer itself.
 d. Since $-12 \dfrac{3}{4}$ is a negative mixed number, we find the smaller integer between $-13$ and $12$. Using the number line as a guide, we can see that the smaller integer is $-13$.

Example 2
If $f(x) = [2x + 1]$, what is the value of $f(-3.2)$?
Solution
We substitute $-3.2$ into the expression for $f(x)$ and simplify the value inside the bracket.
$\begin{aligned} f(-3.2) &= [2(-3.2) + 1]\\&=[ -6.4 + 1]\\&=[-5.4]\end{aligned}$
To find $[-5.4]$, select the next integer smaller, so that’s $-6$. Hence, $f(-3.2) = -6$.
Example 3
If $g(x) = [-27x^2 + 1]$, what is the value of $g\left(-\dfrac{1}{3}\right)$?
Solution
We substitute $-\dfrac{1}{3}$ into the expression for $g(x)$ and simplify the value inside the bracket.
$\begin{aligned} g\left(-\dfrac{1}{3}\right) &= [-27(-1/3)2 + 1]\\ &= [ -27(1/9) + 1]\\ &= [-3 + 1]\\ &= [-2] \end{aligned}$
Since $[-2]$ contains a negative integer, we return the same value. Hence, $f\left(-\dfrac{1}{3}\right) = -2$.
Example 4
Construct the table of values of $f(x) = [x] + 1$ for the intervals $-3$ to $3$.
Solution
Substitute each integer between $-3$ and $3$ into the function. Let’s try $f(-3)$.
$\begin{aligned} g(-3) &= [-3] + 1\\&= [ -3] + 1 \end{aligned}$
Since $[-3]$ contains a negative integer, we return the same value. Hence, $f(-3) = -2$.
Apply the same process for finding the greatest integer values of the rest and summarize the results using a table.
| $\boldsymbol{x}$ | $\boldsymbol{y = [x]+1}$ | Closed Dot | Open Dot |
| $[-3, -2)$ | $[-3] + 1 = -2$ | $(-3, -2)$ | $(-2, -2)$ |
| $[-2, -1)$ | $[-2] + 1 = -1$ | $(-2, -1)$ | $(-1, -1)$ |
| $[-1, 0)$ | $[-1] + 1 = 0$ | $(-1, 0)$ | $(0, 0)$ |
| $[0, 1)$ | $[0] + 1 = 1$ | $(0, 1)$ | $(1, 1)$ |
| $[1, 2)$ | $[1] + 1 = 2$ | $(1, 2)$ | $(2, 2)$ |
| $[2, 3)$ | $[2] + 1= 3$ | $(2, 2)$ | $(3, 3)$ |
| $[3, 4)$ | $[3] + 1 = 4$ | $(3, 4)$ | $(4, 4)$ |
It’s helpful to also take note of the ordered pairs that are filled and unfilled. The table above summarizes the values of $f(x)$ for the intervals $-3$ to $3$.
Example 5
Use the table of values from Example 4 to graph $ f(x) = [x] + 1$.
Solution
Using the table of values, plot the filled and unfilled dots on the graph first. Connect each pair of dots with a vertical line to cover all the other values between the two integers.
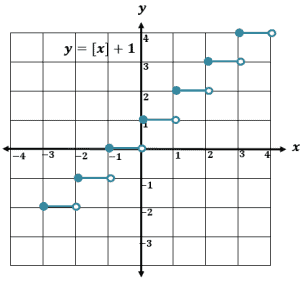
The graph above shows the step function, $f(x) = [x]+ 1$. Notice that its function is actually just the graph of $y = [x]$ but translated one unit upward.
Example 5
Graph $g(x) = \left[\dfrac{x}{2}\right] + \dfrac{1}{2}$ using any method. Compare the graphs with the graph of $y = [x]$.
Solution
Although we can graph $g(x)$ by constructing tables, let’s try comparing the function to $y = [x]$ to see the translations done.
Since $\dfrac{1}{2}$ is a coefficient of $x$ in $[x]$, we can see that the graph would be stretch vertically by a factor of $2$.
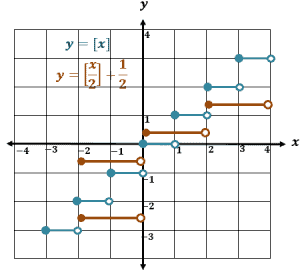
After stretching the graph of $y = [x]$, translate the graph $\dfrac{1}{2}$ unit upward. The graph in orange shows the graph of $y = \left[\dfrac{x}{2}\right] + \dfrac{1}{2}$.
You can also try graphing the step function by constructing a table of values.
Practice Questions
![]()
Images/mathematical drawings are created with GeoGebra.
