JUMP TO TOPIC
Slide|Definition & Meaning
Definition
In math and geometry, sliding is when we move a set of points defining some shape by an equal amount in any direction. Therefore, the shape remains exactly the same in every way; it just moves to a different place. In other words, to slide a shape means to move it without rescaling, turning, or flipping it in any way. Formally, sliding is known as translation.
Demonstration of the Concept of Slide
In the study of mathematics, the real world is represented by symbols, numbers, and equations. It is a universal language that facilitates understanding complicated ideas, problem-solving, and prediction.
In mathematics, the term “slide,” also known as “translation,” is used to describe the movement of a figure over a specific distance and in a specific direction. In this article, we’ll talk about the mathematical idea of slides and how it’s used in subjects like geometry, algebra, and trigonometry.

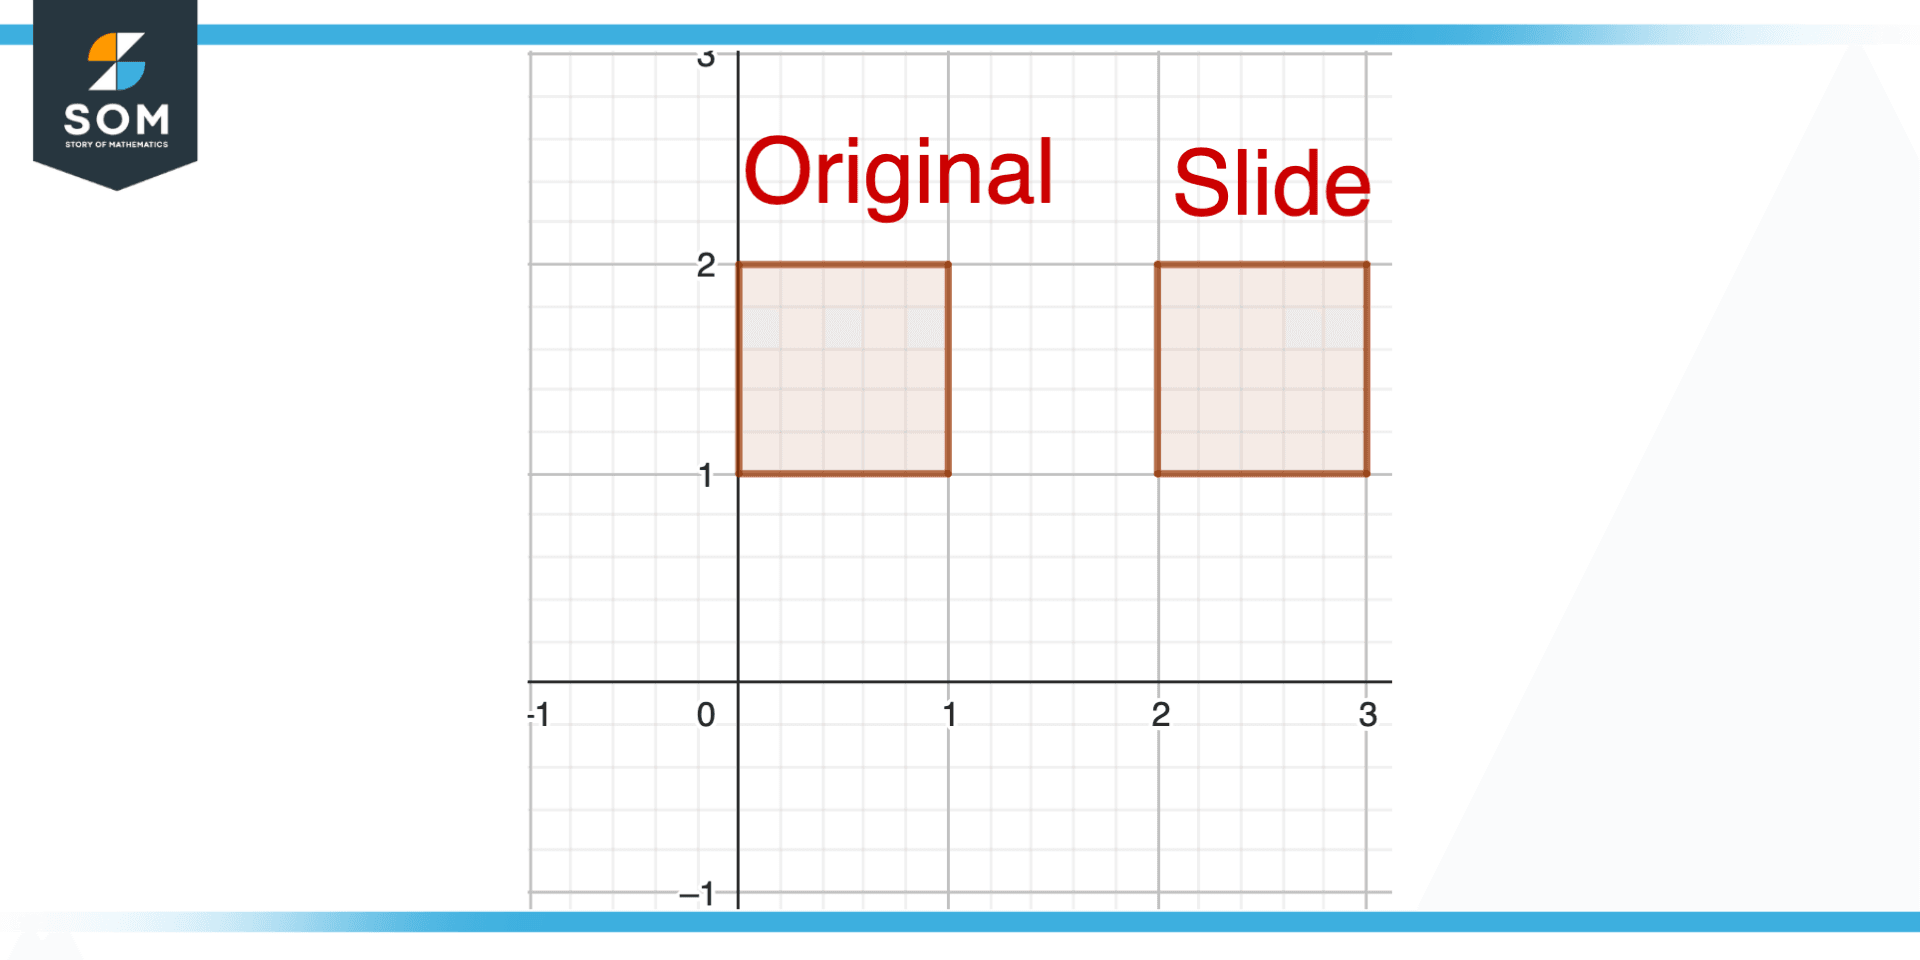
Figure 1 – Concept of Slide in Geometry
Geometric Slide
The study of the characteristics and connections between points, lines, angles, and shapes in space is known as Geometry. A slide is a type of transformation used in geometry that involves moving a figure a specific amount in one direction. To accomplish this, move each point of the figure in the same direction and over the same distance.
As a result, only the figure’s position is altered; its size and shape are unaltered.
When comparing or analyzing figures that are similar but not congruent, slides are helpful in geometry. For instance, we can use a slide transformation to move a square to a different location if we have one and want to. The figure is moved without altering its size, orientation, or shape. This makes it simple for us to evaluate how the figures are situated and interconnected.
Algebraic Slide

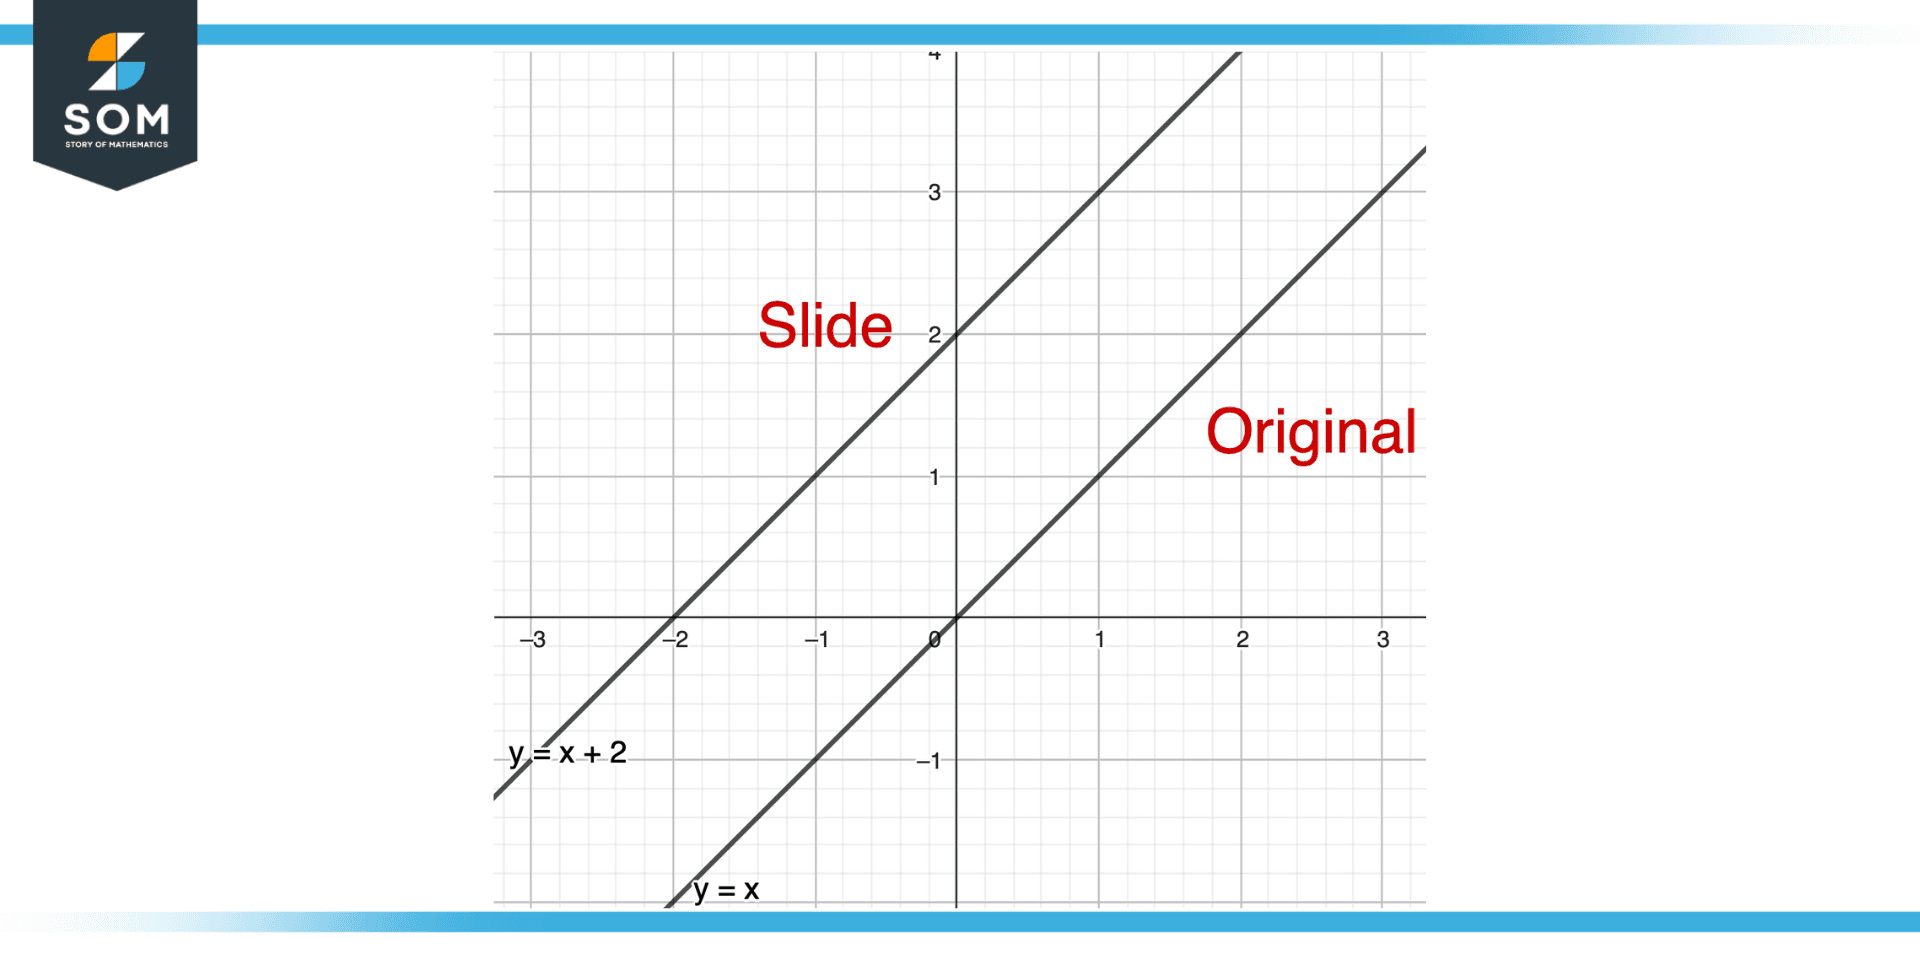
Figure 2 – Slide in Algebraic Domain
In the field of mathematics known as algebra, variables, equations, and functions are all addressed. In algebra, slides can be used to translate a function’s graph in a specific direction and over a specific distance.
This is accomplished by increasing the independent variable of the function by a constant. As an illustration, to translate the function y = x two units to the right, we would add 2 to x, creating the new function y = x + 2.
The new function’s graph will resemble that of the original function, with the exception that it will be two units to the right. The behavior of the function can then be compared and analyzed as it is translated in various directions and distances.
Trigonometric Slide

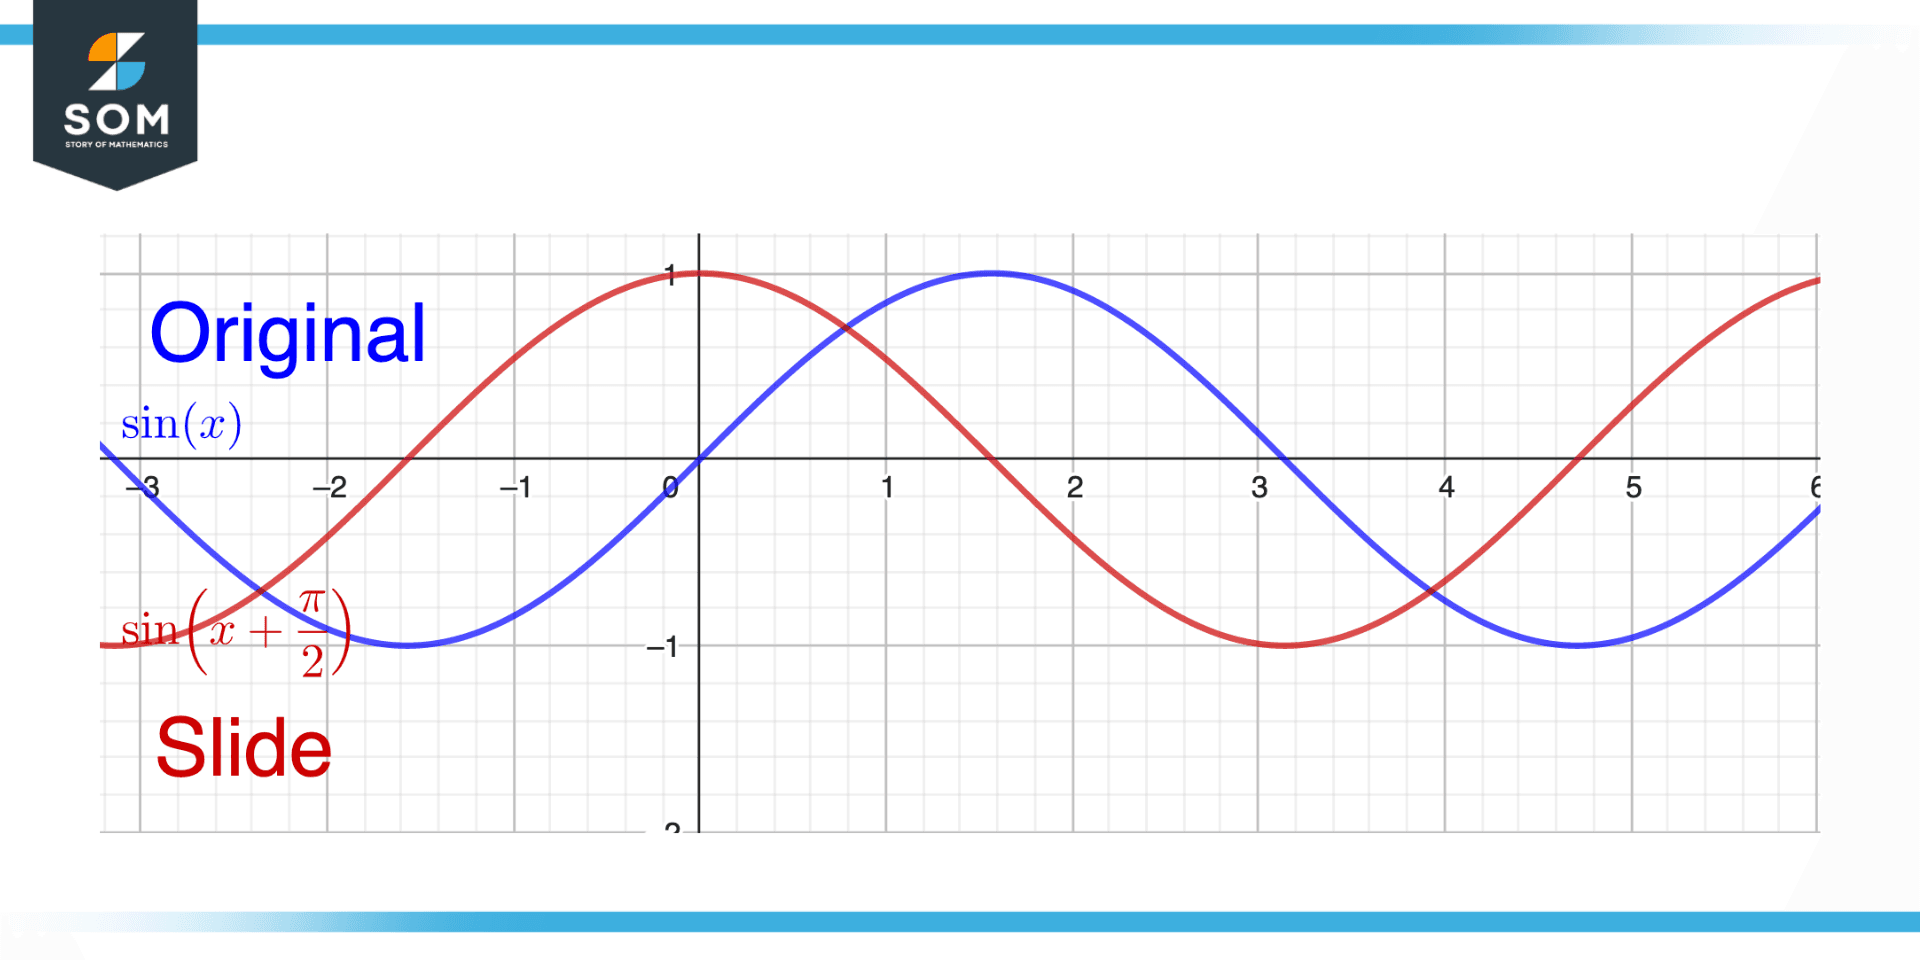
Figure 3 – Slide in the context of Trigonometry
The relationships between the sides and angles of triangles are the subject of the mathematical discipline of trigonometry. Slides can be used in trigonometry to translate the graph of a trigonometric function in a specific direction and over a specific distance. This is accomplished by increasing the independent variable of the function by a constant.
As an illustration, if we want to translate the sine function y = sin(x) pi/2 units to the right, we would add pi/2 to x, creating the new function y = sin(x + pi/2).
The graph of the new function will merely be pi/2 units to the right of the graph of the original function. The behavior of the function can then be compared and analyzed as it is translated in various directions and distances.
Procedure To Find Slide
Finding a slide of a function, also referred to as a translation, is done as follows:
- The original function’s equation, f, should be written down (x).
- Decide on the translation’s magnitude and direction. A slide to the right is represented by the equation’s x-term having a positive constant added to it. A slide to the left is represented by the equation’s x-term having a negative constant added to it. The constant’s value determines how large a translation will be.
- Add the constant to the x-term in the original function’s equation. The equation of the translated function, g, is what is produced as a result (x).
- To see the impact of the translation, plot both the original function, f(x), and the translated function, g(x), on the same coordinate plane.
The equation of the translated function would be g(x) = 2(x-2), for instance, if f(x) = 2x and we wanted to translate the function 2 units to the right.
Properties of Slide
The following are the characteristics of a slide (or translation) of a function:
- The Shape is Preserved: A slide does not alter the design of a function’s graph. The graph is only moved horizontally or vertically.
- The Direction of the Slide: direction determines whether a slide is moving up, down, to the right, to the left, or in any other direction.
- The Magnitude of the Slide: The value of the constant added to the x- or y-term of the original equation determines the magnitude of a slide.
- Commutative Property: The result is unaffected by the order in which the slides are executed. In other words, if f(x) is shifted by a constant c to get g(x), and g(x) is shifted by a constant d to get h(x), then h(x) = g(x + d) = f(x + c + d).
- Additivity Property: The combined effect of two slides is equal to the combined effect of one slide. In other words, if f(x) is shifted by a constant c to get g(x) and f(x) is shifted by a constant d to get h(x), then h(x) = g(x + d) = f(x + c + d).
These characteristics can be helpful in resolving issues in mathematics and other related fields, as well as in understanding the impact of a slide on the graph of a function.
Solved Example of an Equation With a Slide Offset
Example 1
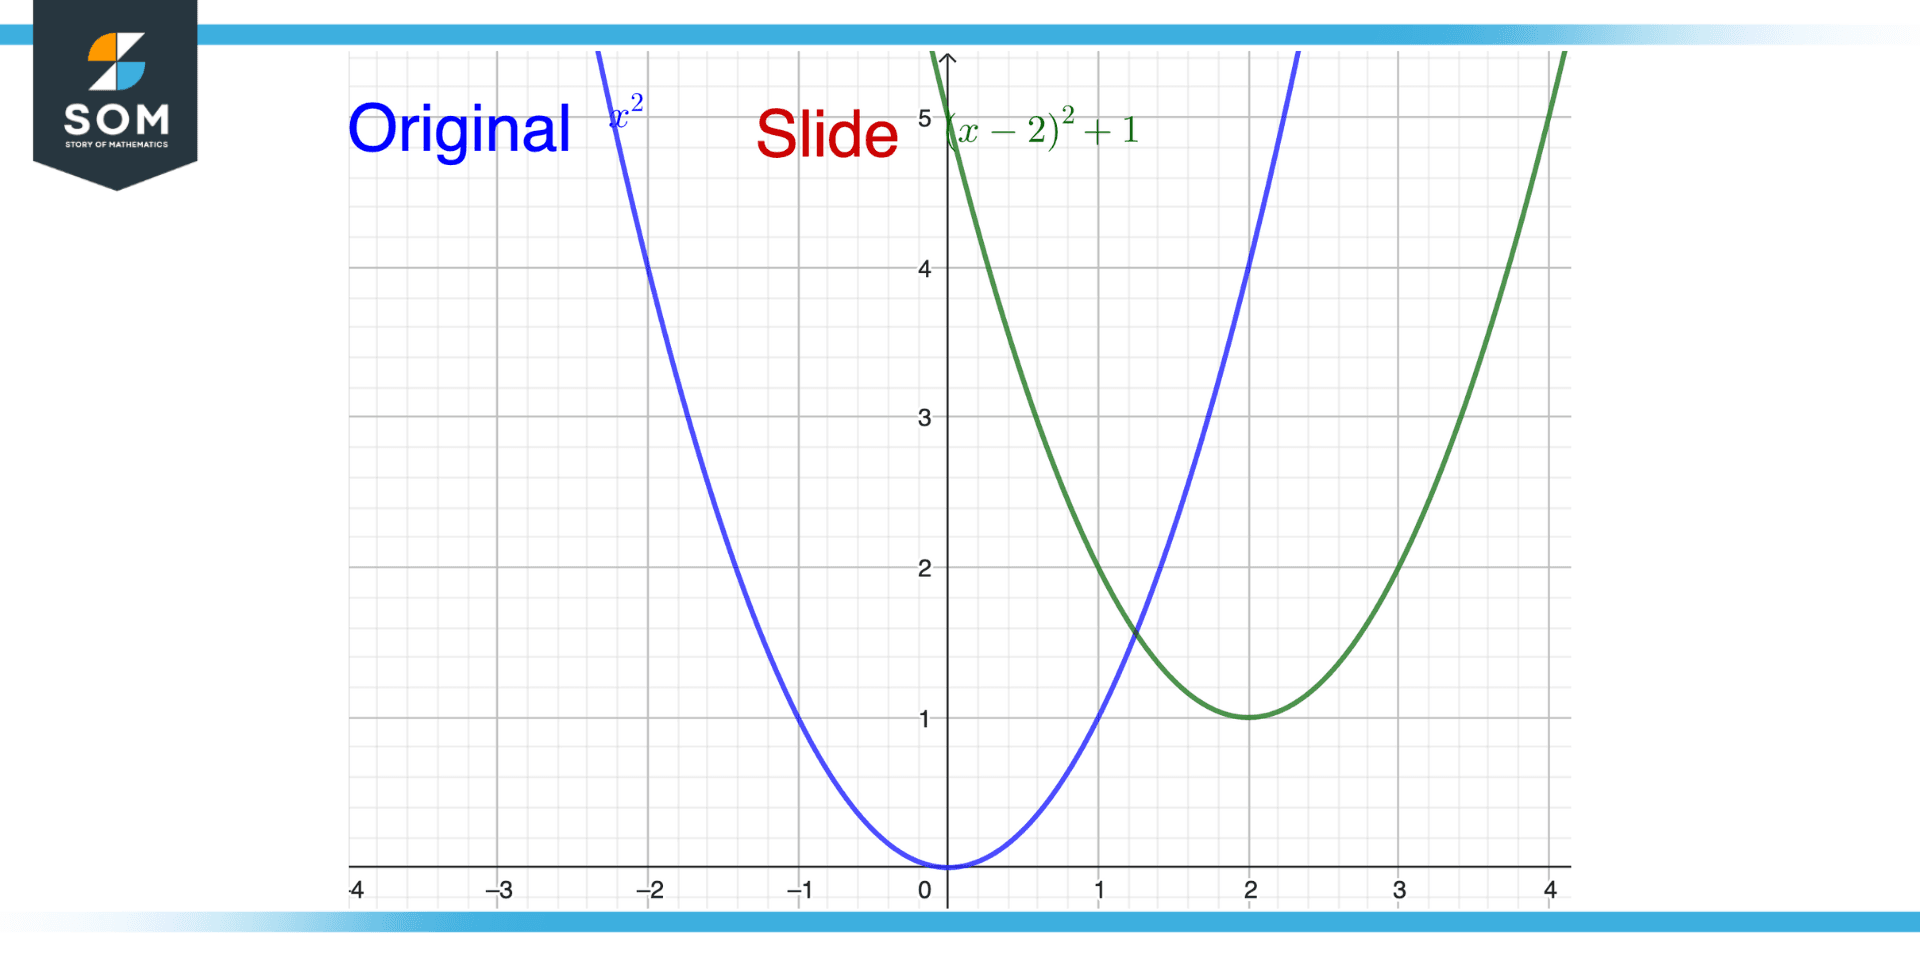
Find the equation of the translated function that is moved 2 units to the right and 1 unit up, given the function f(x) = x2.
Solution

Figure 4 – Example of Slide
The direction and magnitude of the translation must be specified to determine the equation of the translated function. We want to translate the function, in this case, 2 units to the right and 1 unit up.
The original equation’s x-term is subtracted by 2, and the y-term is increased by 1 to produce the equation for the translated function:
g(x) = (x – 2)2 + 1
The graph of g(x) is identical to the graph of f(x), with a 2 rightward and 1 upward shift.
All mathematical drawings and images were created with GeoGebra.
