JUMP TO TOPIC
Logarithmic Scale|Definition & Meaning
Definition
A nonlinear scale that is frequently utilized in the process of assessing a wide variety of values is known as a logarithmic scale. Every period is increased by nearly the base of a logarithm rather than growing in equal increments as the logarithm progresses. The scales of base ten as well as base e are the most common ones to use.
A technique for charting and evaluating a wide range of values is the use of a logarithmic scale. Log scales rise by an exponential ratio as opposed to linear functions, which increase or decrease in equal steps. When graphing logarithms, analysts frequently employ a power of 10 or a base e scale, where the incremental rise or fall by a factor of a logarithmic base.
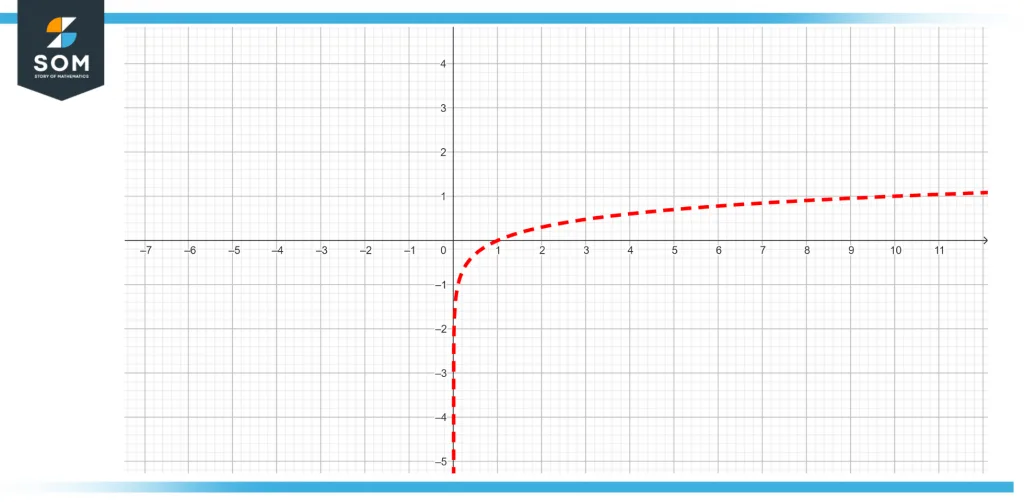
The graph of a function expressed as a positive logarithm is shown below in the following figure.

Figure 1 – Graph of a positive logarithmic function
How Exactly Does One Use a Logarithmic Scale?
You can generate a scale by utilizing integer increments with such a linear function, and each increment will reflect the same amount of units throughout the entire scale. The scale that displays when using a logarithmic function does so in increments that correspond to the powers by which a value is being multiplied. For instance, you might see a scale of one along the axis of a linear graph, with increments that either rise or drop by one point. This scale represents increments depending on the power of a certain number on a logarithmic graph.
Appropriate Times To Employ Logarithmic Scales
When working with data that contains extreme outliers, such as very large or very small numbers, log scales become indispensable. When viewing data points that differ significantly from one another in terms of percentage, you can also employ a logarithmic scale. In general, you would select logarithmic scales if indeed the data in the graph covers a huge range, like an exponentially growing rate. This is because logarithmic scales are linearly proportional to logarithms. The following is a list of professions that frequently make use of log scales in their work:
- Actuarial science entails the calculation of costs and risks by an actuary, who may also make use of a logarithmic scale while determining various insurance metrics.
- Log scales are frequently used in nuclear and internal medicine by related to healthcare professionals to quantify factors such as pH values, radioactive decay, health changes, and bacterial proliferation.
- In the fields of statistics and analytics, logarithmic scales are used when dealing with.
- Interest rates are typically presented in logarithmic increments by financial advisors so that clients may more easily comprehend the growth of an asset or the collective wealth of a group of people.
- Geologists once measured earthquake activity on the Richter scale, a logarithmic application.
The Formula for the Logarithmic Scale
When graphing a wide range of values using a log scale, each interval expands or contracts exponentially. Here is the formula for calculating logarithms so that the scale can be determined:
\[y = log_b x \]
The b-variable in the formula indicates the base number, while the y-variable denotes the exponents to which the base number is raised. The x variable reflects the result of raising the base to the y power. To use a base-10 scale, one would substitute 10 for the b-variable:
\[y = log_{10} x \]
An Explanation of the Logarithmic Equation’s Use
Graphing right to left on a logarithmic scale involves multiplication or division by powers of 10 or any other predetermined exponential value. The formula and the methods below can be used to calculate the logarithmic scale of any given collection of numbers:
Replace the Y-variable With Its Value
Logarithms are a straightforward method for simplifying the solution of exponential functions. Find out what the value of the y-variable is by employing a base of 10. You are able to compute the function in order to determine the x-variable if you use this value for y. Take, for instance, the case where you are graphing a logarithmic function and you have a value of 1,500 for the y-axis. You would replace this with the following in the formula:
\[1500 = log_{10} x \]
Perform the Computation for the Logarithmic Function
You need to do some algebraic work to calculate the log function before you can figure out what the x variable is. You may solve the log problem using the example from before for a y-value of 1,500 by switching to an exponential function and calculating the following:
10x = 1,500
The value of the exponent, which is required to figure out the scale for the graph, can be obtained by finding the x-value.
Find the Value of X
It is possible to calculate the change in the value of each interval by solving for the x-variable. In the earlier illustration, the x-value of 3.18 is calculated by calculating 10x = 1,500. The x-value grows by a factor of 10 for every tenfold increase in the y-value; for example, a y-value = 1,500 would result in an x-value of 31.76.
Representation of Logarithmic Scale Graphically
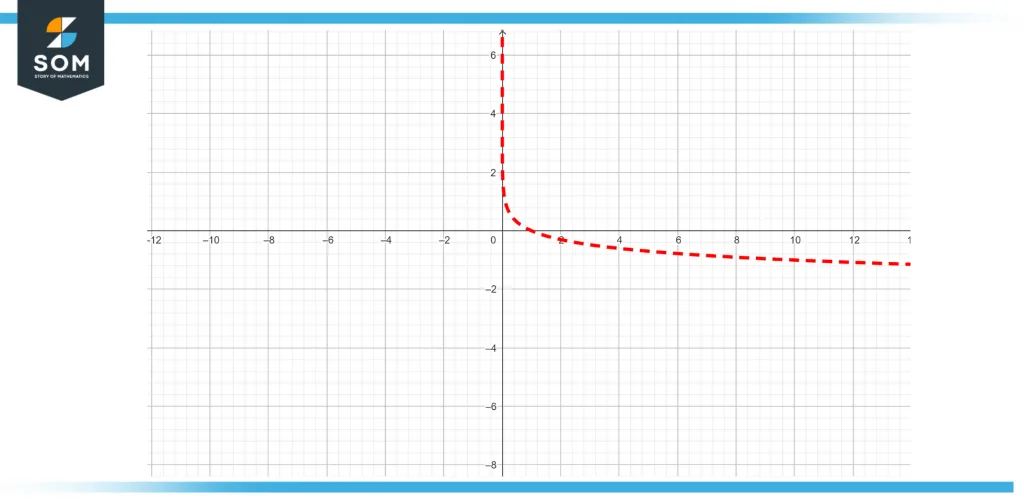
The graph of a function that is written as a negative logarithm can be seen below in the figure that has been provided for your reference.

Figure 2 – Visual representation of negative log function
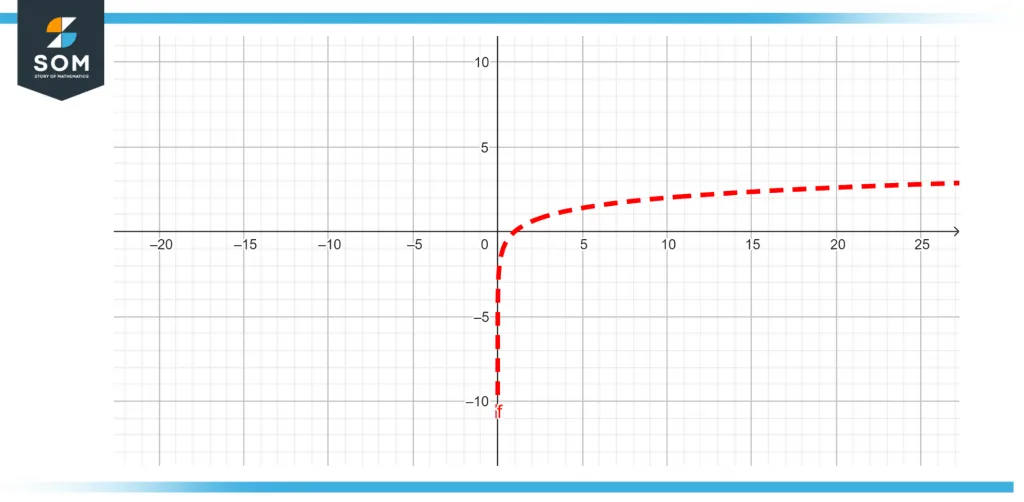
The graph of a function expressed as a negative and positive logarithm is depicted in the figure below.

Figure 3 – Graph of a positive and negative logarithmic function
A Numerical Example of a Logarithm Scale
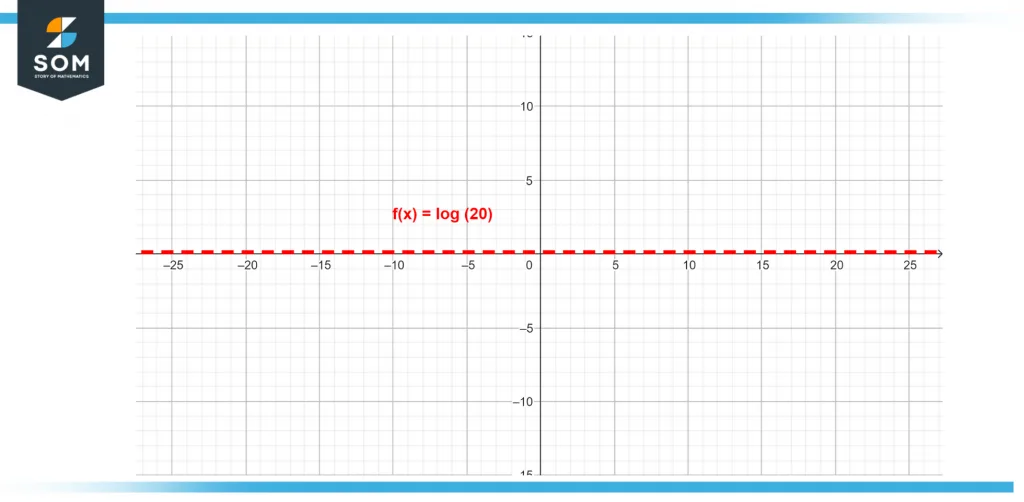
Find the logarithm value for x when x is equal to 20. Also, represent the value with a graph.
Solution
Given that:
x = 20
We have to find the log value of 20:
log(20) = 1.3
The following figure represents the logarithmic graph for the given value of x, which is 20.

Figure 4 – Logarithmic graph for the value of 20
All images/mathematical drawings were created with GeoGebra.
