JUMP TO TOPIC
Increment|Definition & Meaning
Definition
Increment means the amount or value by which something grows. In math, if the value of a variable increases by some amount, then that amount is called an increment.
The term increment describes the positive changes in variable values. Simply put, it represents the arithmetic operation of addition. There is an original value (the first addend) and the value by which it increases (the second addend). The latter is the increment, and the final result is the sum of the two.
original value + increment = new larger value
Consider that you have two apples. An increment of one apple would then give you three apples, as shown below:
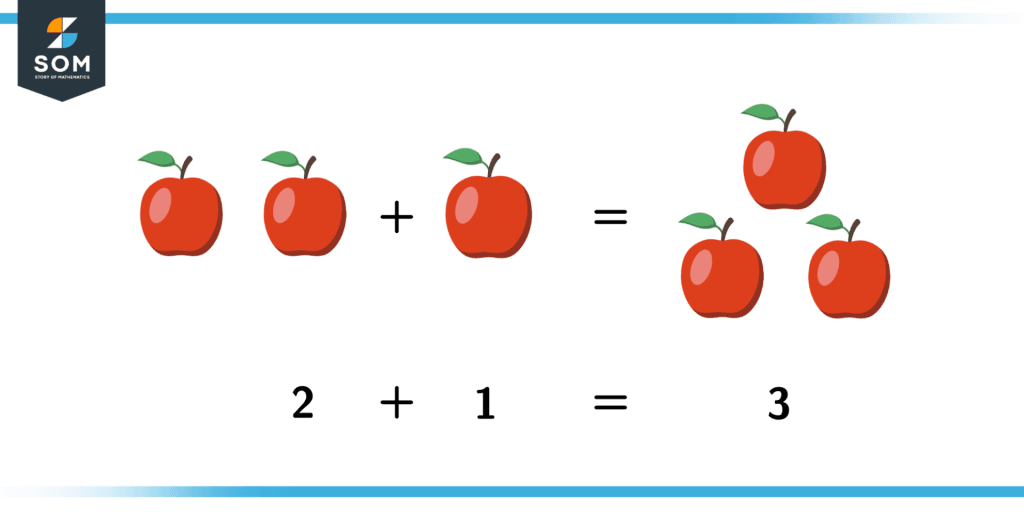
Figure 1 – Incrementing a couple of apples. Incrementing is simply adding stuff!
Usually, you will see it used to represent small increases. Gain is another term that means the same thing, but most people use it to show a large amount of change (like the gain of guitar amplifiers).
The delta symbol “$\Delta$” denotes a change in value and is therefore used to represent increments. For example, if the variable is x, then $\boldsymbol\Delta$x represents the increment such that the result is x + $\boldsymbol\Delta$x.
Decrements
Decrements are the opposite of increments: they show small negative changes in values. In other words, a decrement represents the value subtracted from some original amount.
original value – decrement = new smaller value
Consider the same apple example from before:
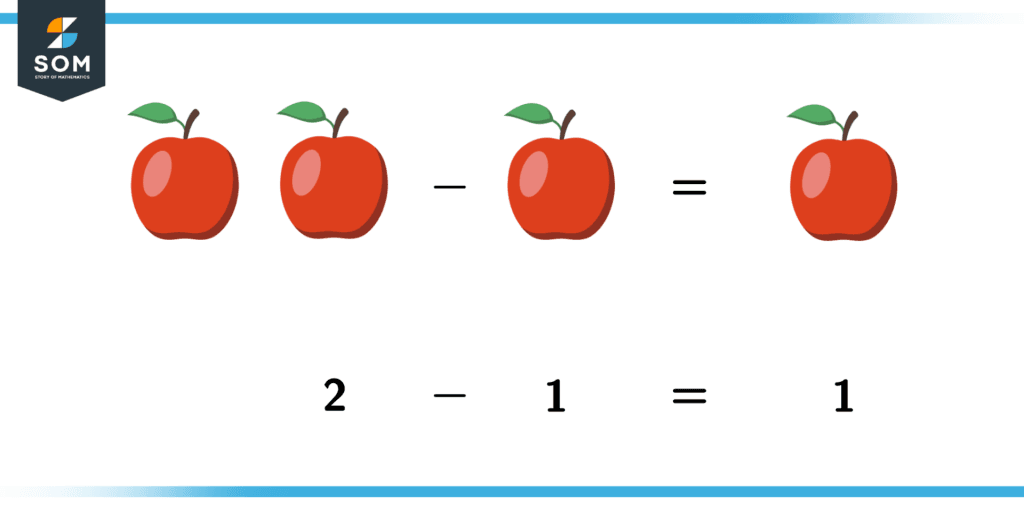
Figure 2 – Decrementing is the opposite of incrementing – subtracting stuff!
Thus, a change in some variable’s value can either be an increment or a decrement. A decrement is represented with x – $\boldsymbol\Delta$x.
Some Practical Examples Using Increments
Since increments are small additions to some original value, let us consider simple counting. When we count 1, 2, 3, we are simply incrementing by 1 for every next entry. Therefore, if we start at 1 (first entry), the next one is 1 + 1 = 2 (second entry). The number after 2 is 2 + 1 = 3 (third entry), and so on.
Now consider the set of positive even numbers {0, 2, 4, 6, 8, …}. Here, entry number x$_\mathsf{i+1}$ = x$_\mathsf{i}$ + $\Delta$ x where $\Delta$x = 2. Thus, we have an increment of 2 for each subsequent entry in this sequence.
Now, suppose you want to buy tickets to a fair. The base price for a single person is \$15. However, there is a family offer for up to five members, such that for each extra member, you only have to pay \$5. We illustrate this below:
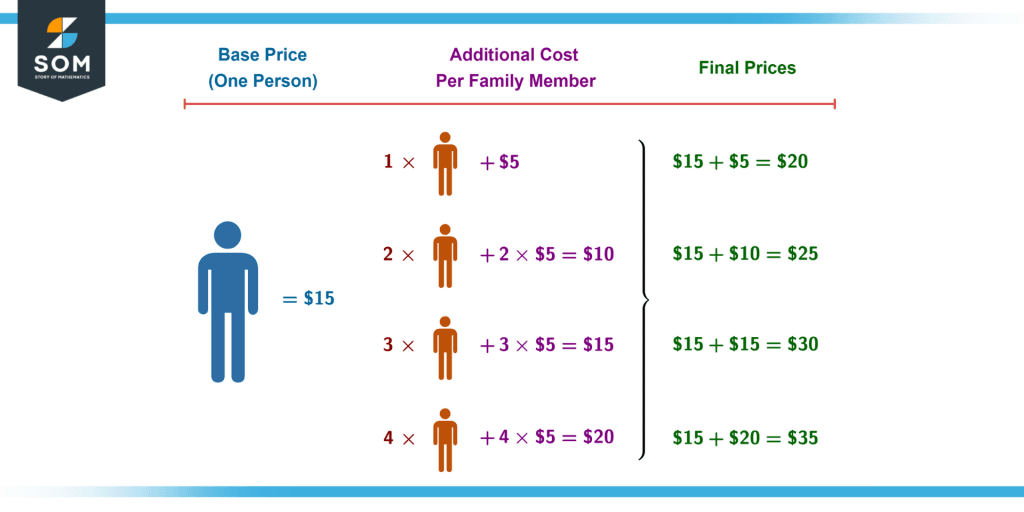
Figure 3 – Fair tickets family deal in the form of incremented costs.
Thus, each additional family member saves \$10 by using the family coupon. If each person bought a separate ticket, the cost of five tickets would be 5 x \$15 = \$75. With the family offer on five members, everybody gets to enjoy the fair with just \$35, saving \$75 – \$35 = \$40!
Increments in Functions
Consider a straight line with a slope equal to m and a y-intercept equal to c. The equation of the line is then:
y = mx + c
If x is the only variable, then y is a function of x:
y = f(x)
Suppose you want to plot the line. To plot a line by hand, we only need two points on it. For example, you could evaluate it at x = 1 and x = 2 (increment of 1), or x = 1 and x = 3 (increment of 2), and you would get the same line.
Mathematically, we can represent this with increments:
y = f(x) $\to$ y = f(x + $\boldsymbol\Delta$x)
y = mx + c $\to$ y = m(x + $\boldsymbol\Delta$x) + c
Plotting Function Curves
What if you wanted to plot a more complex curve? Consider the function f(x) = x$^\mathsf{2}$, which represents an exponential curve.
The plan is to evaluate the function for constant increments of x. That gives us a bunch of points on the graph – joining them together results in a rough estimate of the curve’s shape. Mathematically, if we were to plot the curve with n points, then:
\[ \begin{aligned} p_1: {}&f(x) = x^2 \\ p_2: {}&f(x + \Delta x) = (x + \Delta x)^2 \\ p_3: {}&f(x + 2\Delta x) = (x + 2\Delta x)^2 \\ &\!\!\!\!\!\!\!\!\!\vdots \\ p_n:{}&f(x + n\Delta x) = (x + n\Delta x)^2 \end{aligned} \]
Let us try to plot the f(x) = y = sin(x) curve using this approach. Consider the interval [-90, 90] in degrees, and let us increment by 15 degrees for every point on the curve. Then, we will have n = 13 points on the curve:
\[ \begin{aligned} p_1: {}&\sin(-90^\circ) = -1 \\ p_2: {}&\sin(-75^\circ) = -0.9659 \\ p_3: {}&\sin(-60^\circ) = -0.866 \\ &\!\!\!\!\!\!\!\!\!\vdots \\ p_{11}:{}&\,\,\,\,\,\sin(60^\circ) = 0.866 \\ p_{12}:{}&\,\,\,\,\,\sin(75^\circ) = 0.9659 \\ p_{13}:{}&\,\,\,\,\,\sin(90^\circ) = 1 \end{aligned} \]
Plotting these, we get the following graph:
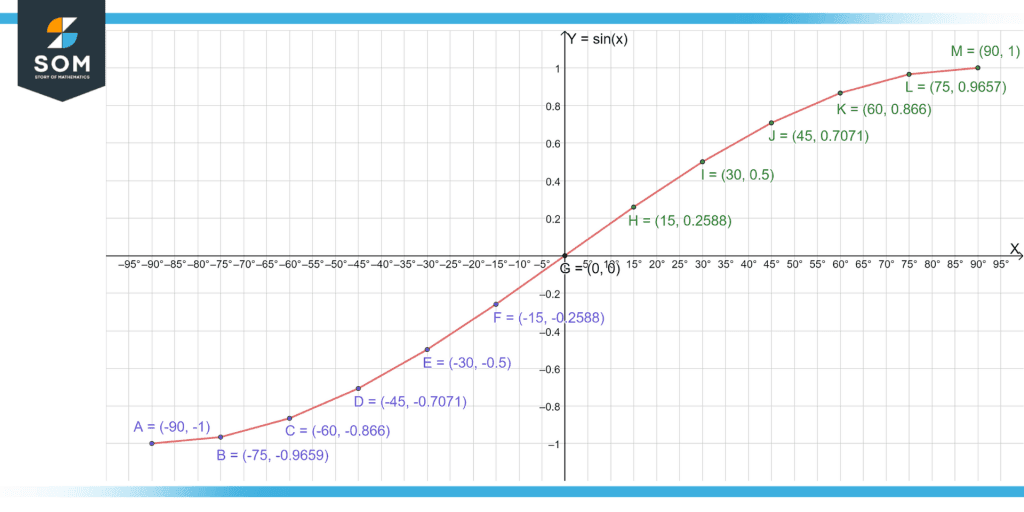
Figure 4 – The y = sin(x) curve by evaluating it at constant increments of 15 degrees and joining all the results with a straight line.
This approach is a chore by hand, but graphing calculators and other tools are quick and give us a plot in no time.
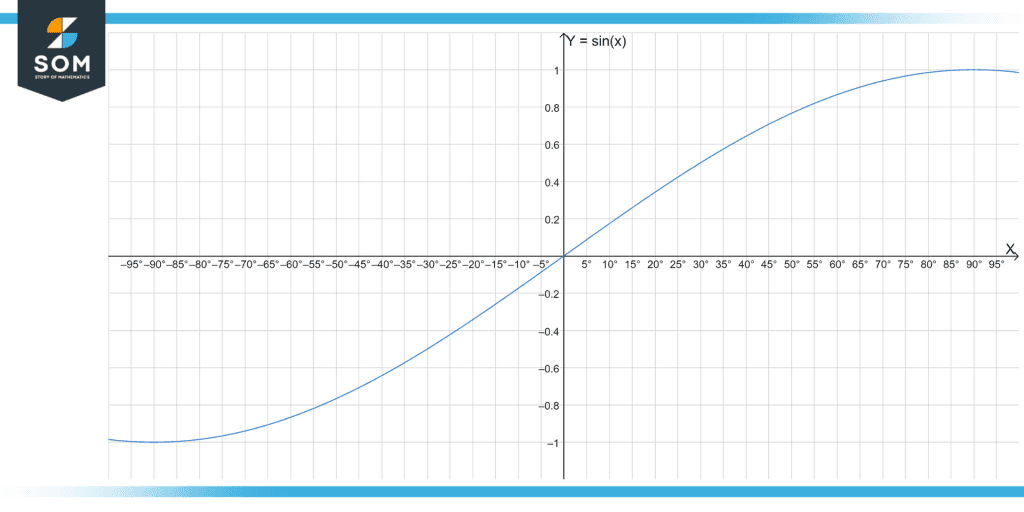
Figure 5 – The y = sin(x) curve by Geogebra.
An Example of Incrementing Function Variables
Consider the algebraic function f(x, y) = x + 2xy + y. Find the expression if both x and y are incremented by 2.
Solution
We need to find the function value for an increment of 1 on both variables. Thus, if $\Delta$x = $\Delta$y = 2, then:
f(x, y) $\to$ f(x + $\Delta$x, y + $\Delta$y) = f(x + 2, y + 2)
Substituting x = x + 2 and y = y + 2 in the original expression:
f(x + 2, y + 2) = (x + 2) + 2(x + 2)(y + 2) + (y + 2)
Expanding the right-hand side:
f(x + 2, y + 2) = x + y + 4 + 2(xy + 2x + 2y + 4)
f(x + 2, y + 2) = x + y + 4 + 2xy + 4x + 4y + 8
f(x + 2, y + 2) = 5x + 5y + 2xy + 12
That is the desired result.
All mathematical drawings and images were created with GeoGebra.
