JUMP TO TOPIC
Deviation|Definition & Meaning
Definition
Deviation refers to the difference of a value from a reference value. The most common reference used is the mean of the data. Sign of the signed deviation gives the direction of the value under consideration since a positive deviation means that the value is greater than the reference value. Absolute deviation only gives the magnitude of the deviation and is always positive.
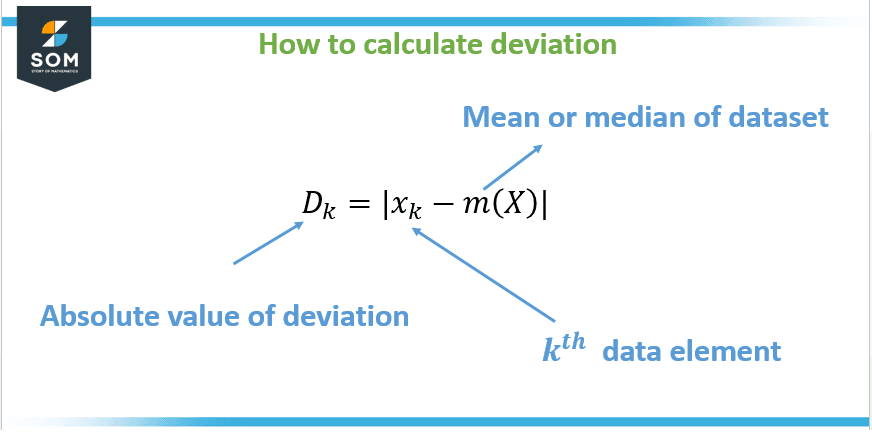
Deviation refers to the difference between a measured or calculated value and a standard or expected value. In statistics, the deviation can also refer to the difference between a data point and the mean of a dataset. The general formula for calculating deviation is depicted in Figure 1 below:

Figure 1: Formula to compute deviation
In engineering and quality control, deviation refers to how much a product or process deviates from the desired or specified parameters. Deviation can also refer to a departure or deviation from a norm, rule, or standard in other fields, such as behavior or thought.
The deviation is an important concept in statistics and other fields because it allows for the quantification of how much a value or set of values differs from a standard or expected value.
In statistics, the deviation is used to measure the spread or dispersion of a dataset, which can provide important information about the data distribution.
In quality control, a deviation is used to determine how much a product or process deviates from the desired or specified parameters, which can help identify and correct issues in the manufacturing process.
Deviation can also be used in other fields, such as psychology and sociology, to measure how much an individual or group deviates from the norm or average. This can be useful in identifying and understanding atypical behavior or thought patterns.
In general, a deviation is an important tool for understanding and describing the variation and diversity within a dataset or population. By measuring deviation, researchers and practitioners can make more informed decisions and take appropriate actions based on the data.
Types of Deviation
Mean Deviation
The difference between a data point and the mean of a dataset.
Standard Deviation
A measurement of a dataset’s dispersion is obtained by taking the variance’s square root.
Mean Absolute Deviation
The average of the absolute differences between a data point and the mean.
Median Absolute Deviation
The average of the absolute differences between a data point and the median.
Variance
A measurement of a dataset’s distribution is created by averaging the squared deviations among each data point and the mean.
Root Mean Square Deviation
The average variation of a collection of data is evaluated by the square root of the variance.
Maximum Deviation
The greatest difference between a data point and the mean or median of a dataset.
Minimum Deviation
The least difference between a data point and the mean or median of a dataset.
Percent Deviation
The difference between a data point and the mean or median of a dataset is expressed as a percentage of the mean or median.
Relative Deviation
The ratio of the deviation to the true value.
Unsigned or Absolute Deviation
Unsigned deviation and absolute deviation both refer to the same concept: the absolute difference between a value and a standard or expected value.
The term “unsigned” simply means that the deviation is expressed as a positive value, regardless of whether the actual deviation is above or below the standard value. The absolute deviation is also expressed as a positive value, regardless of whether the deviation is above or below the standard value.
For example, if the standard value is 10 and the actual value is 8, the absolute deviation is 2. If the actual value is 12, the absolute deviation is still 2. In both cases, the deviation is expressed as a positive value of 2.
The unsigned or absolute deviation is used in many fields, such as statistics and quality control, because it allows for the quantification of how much a value or set of values deviates from a standard without taking into account the direction of the deviation (positive or negative).
This can be useful in certain situations where the direction of deviation is not important and only the magnitude of deviation matters. The mathematical expression for unsigned or absolute deviation is given below:
Absolute Deviation =|x – $\bar{x}$|
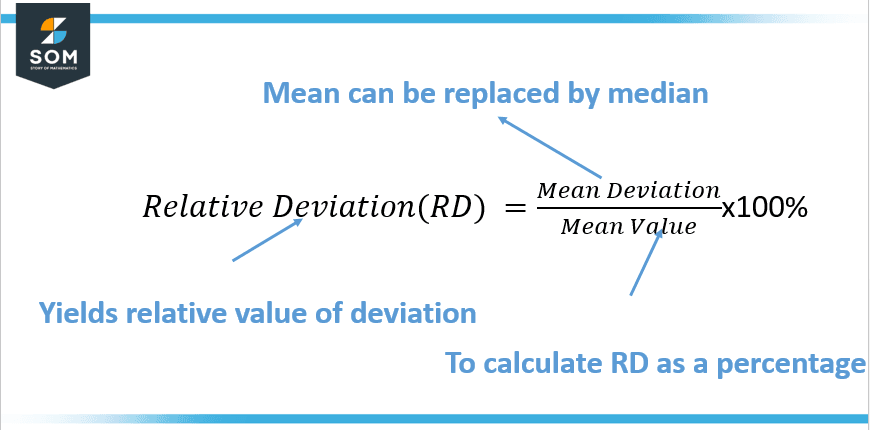
where x is the value in question and x̄ is the standard or expected value. The vertical bars | | represent absolute value, which ensures that the deviation is always expressed as a positive value. However, the relation for computation of relative deviation has been shown in Figure 2 below:

Figure 2: Computing relative deviation
Mean Signed Deviation
Mean signed deviation is a measure of the average deviation of a dataset, taking into account the direction of the deviation (positive or negative). It is calculated by adding up and dividing by the total number of data elements the variances of each data point from the mean.
The mathematical expression for the mean signed deviation is:
Mean Signed Deviation = Σ(x – $\bar{x}$) / n
where x is the individual data point, x̄ is the mean of the dataset, Σ represents the summation of all values, and n is the number of observations in the data set.
The use of mean signed deviation allows measuring both the magnitude and direction of deviation. Positive deviation indicates that the value is above the mean, and negative deviation indicates that the value is below the mean.
Mean signed deviation is useful in certain situations where the direction of deviation is important; for example, in time-series data analysis, the negative deviation can indicate a decrease in a particular variable over time, whereas positive deviation can indicate an increase.
Dispersion
Dispersion, also known as variability or spread, refers to how much the values in a dataset vary or differ from each other. It is a gauge of how evenly scattered or dispersed the data is.
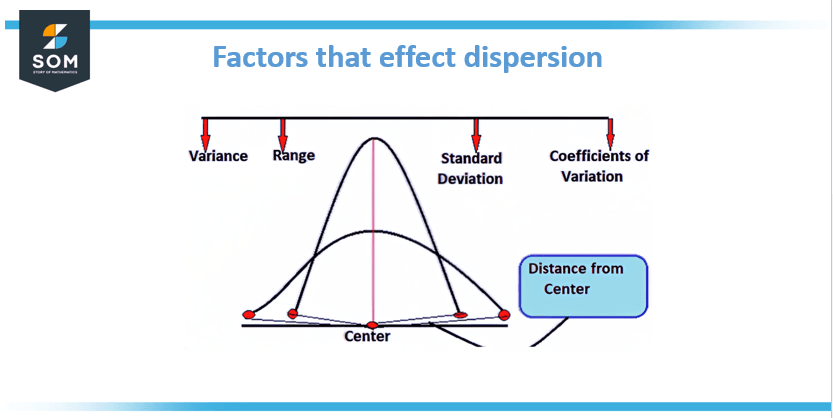
High dispersion means that the values are spread out over a large range, while low dispersion means that the values are concentrated around a central value. The measures of deviation are depicted briefly in Figure 3 below:

Figure 3: Measures for deviation
There are several measures of dispersion, including:
Range
The variation between a dataset’s highest values and lowest values.
Variance
A measurement of a dataset’s dispersion is obtained by averaging the squared deviations across each data point and the mean.
Standard Deviation
A measurement of a dataset’s distribution is determined by taking the variance’s square root.
Interquartile Range (IQR)
The discrepancy here between the dataset’s 75th and 25th percentiles.
Mean Absolute Deviation
The average of the absolute differences between a data point and the mean.
Median Absolute Deviation
The average of the absolute differences between a data point and the median. Dispersion is an important concept in statistics, as it provides information about the distribution of the data, which can help to identify patterns and make predictions.
In addition, dispersion measures are also used in many fields, such as finance, economics, engineering, etc., to evaluate the spread of different variables and make decisions accordingly.
Applications of Deviation Concept
There are many applications of deviation in mathematics; some examples are:
- In statistics, the deviation is used to measure the spread or dispersion of a dataset, which can provide important information about the data distribution. For example, in a study of the heights of adult males, the mean height might be 70 inches, and the standard deviation might be 2 inches. This tells us that the majority of adult males have sizes within 2 inches of the mean.
- In trigonometry, When a light beam is traveling through a prism, the deviation can be used to calculate the angle of deviation. This is important in understanding the behavior of light and in the design of optical instruments such as telescopes and cameras.
- In control systems, the deviation is used to measure how much a system deviates from a desired or specified behavior. This can be used to design feedback control systems to keep a system operating within desired parameters.
- In finance and economics, the deviation is used to measure the volatility of a stock or market index, which can provide important information about the risk and returns of an investment.
- In quality control, the deviation is used to determine how much a product or process deviates from the desired or specified parameters. This can be used to identify and correct issues in the manufacturing process.
- In engineering, the deviation is used to determine the accuracy of a measurement or to check the conformity of a material to a specific standard.
- In meteorology, the deviation is used to measure the deviation of temperature, pressure, and other meteorological parameters from the average values.
- In image processing and computer vision, the deviation is used to measure the difference between the original image and the processed image.
These are just a few applications of the many ways deviation is used in mathematics and other fields.
Example of Calculating Absolute Deviation
Calculate the absolute deviation when the standard value is 10, and the actual value is 8.
Solution
As given, if the standard value is 10 and the actual value is 8, the unsigned deviation would be calculated as follows:
|8 – 10| = |-2| = 2
If the actual value is 12, the unsigned deviation would be calculated as follows:
|12 – 10| = 2
So, in both cases, the deviation is expressed as a positive value of 2, regardless of whether the actual value is above or below the standard value.
All images/mathematical drawings were created with GeoGebra.
