JUMP TO TOPIC
Categorical Data|Definition & Meaning
Definition
Categorical Data is the set of information categorized or divided into groups containing the same type of information from an extensive set.
If a teacher in class wants to know the number of students with black, blonde, or white hair in the class, the collected data on hair colors in groups is the categorical data. A data set can be grouped according to the different variables available in our case it can be red, black, blonde, and white hair color.

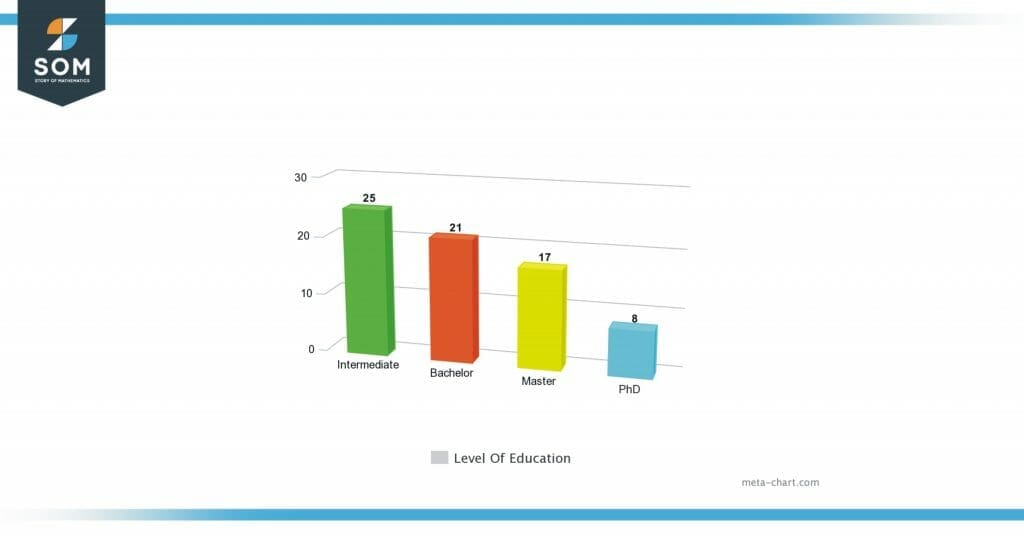
Figure 1 – Level of education is an example of categorical data in which the candidates are categorized according to the level of their study.
Brief Description of Categorical Data
The basic meaning and understanding of Categorical Data can be developed by the name i.e categorical word is derived from category which means a group of the same things that have particular common characteristics. So, in mathematics, the data that is divided on the basis of some specific similar or share information is regarded as categorical data.
We can observe that the data we have can be of different types. Some data can exactly be measured in a proper numerical value and other data might not be numerically measurable. We will discuss these types in the upcoming sections in more detail.
The categorical data is usually represented in the form of tables, charts, and other graphical representations for easy understanding and effective learning and analysis. Grouping large data in specific categories are very helpful action that makes many mathematical and statistical analyses very easy. This type of analysis has many practical applications in real life.
For example, the data of students’ grades in a class is organized and categorized by the groups of grades i.e A, B, C, D, and F. This categorized data helps in calculating and knowing students’ academic standing. On the basis of such categorization, students are awarded results, so categorical data is very important in many aspects of our daily life. One should know the basics of categorical data and should implement it in daily tasks.
Types of Categorical Data
Based on the type of data, categorical data can be divided into two basic types i.e. Nominal and Ordinal Data.
Nominal Data
Nominal Data is the data that represents variables without any numerical value data. This type of data is qualitative in nature ( descriptive nature) and can not be calculated as an accurate numerical value. The nominal data can be remembered by knowing the origin of the word nominal which is derived from a Latin word that means Name.
So, on the basis of its nomenclature origin, this is also known as named data. This type of data can include the characteristics of things like names, religion, color, etc.
Ordinal Data
Ordinal Data is the data ordered in a set or is represented in a proper scale. The data is classified into groups or categories in a variable that is arranged on a scale in order. There is no definite difference between the categories.
For example, if data is categorized according to the level of agreement on an issue it will be in the categories like Strongly agree, Agree, neither agree nor disagree, disagree, and strongly disagree. There is no specific boundary between any of these categories, each member has their own level of disagreement.
Representation of Categorical Data

Figure 2 – This pie chart represents the two categories of gender.
Categorical Data is usually represented graphically. Graphs like pie charts and bar charts are utilized for the comparison of different categorical values against each other. The sections or bars in the graph represent the number of items in each category.
Representation of a pie chart or bar chart depends on the type of data, it can be in counts or in percentages. This should be made clear before creating the charts.
For the analysis of categorical data, data tables are also utilized. The data is represented as a two-way table in which the total number of items are put in the same category. These tables make it easy to compare different categories for deducing some meaningful results from that that are arranged categorically.
Examples of Categorical Data
There is a huge list of examples of categorical data like data on gender (male or female), Hair Color, age groups, level of education (matriculation, intermediate, Bachelor, Master, Ph.D.), Color of eyes, Employment Status, Religion, Country of residence, Types of Pets in someone house, Blood groups (A, B, AB, O), job application data, data of surveys, personality tests, the color of cars, Celebrations ( Birthday and Anniversary) and the list goes on.
All the data collected for the above purposes is usually categorized for easy analysis. These domains cover almost all the dimensions of professional life, this indicates the importance of categorical data in our daily life.
Solving a Practical Example
Consider a class in which there are 25 students and the data is collected about the hair and eye color of students in the class. Data of each individual is collected through a survey. The collected data is then represented in a two-way table as follows:
| Eye Color | |||||
| Hair Color | Blue | Black | Brown | Green | Total |
| Blonde | 1 | 1 | 2 | 1 | 5 |
| Red | 1 | 0 | 1 | 0 | 2 |
| Black | 3 | 2 | 4 | 2 | 11 |
| Brown | 2 | 1 | 3 | 1 | 7 |
| Total | 7 | 4 | 10 | 4 | 25 |
Table 1: Tabulated number of students with specific hair and eye color combinations.
Depict this data as a convenient visual graph.
Solution
In Table 1, the data is presented by counting the number of students for each category of eye color and hair color and putting them under the respective heading. The table shows the total of each quantity regardless of the influence of any other variable on it.
For example, the total number of students with black hair in the class is 11 regardless of eye color. This data can also be covered in the percentage and then analyzed but the such method is preferred if the data set is more complex.
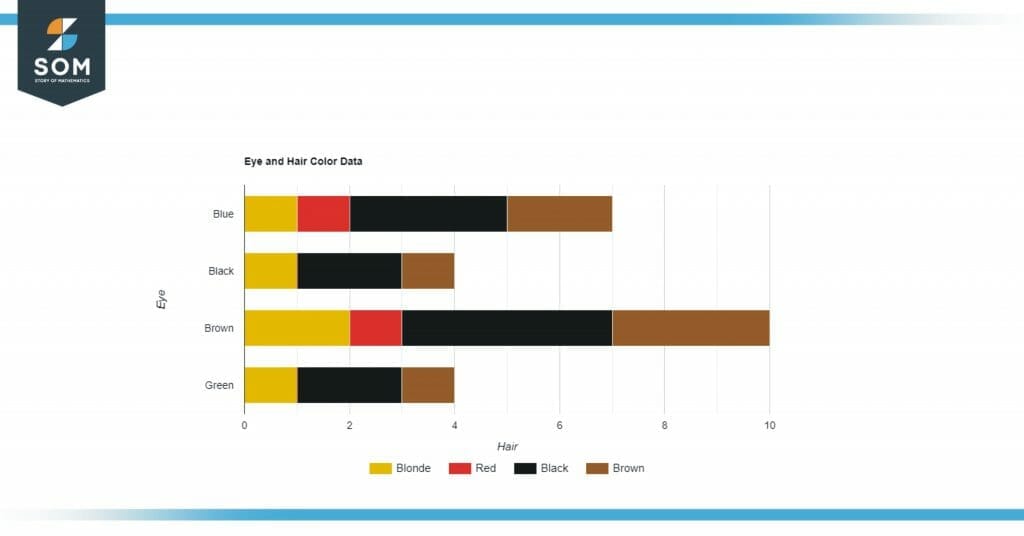
We studied above under the title of Representation of Categorical Data that the categorical data can also be analyzed using graphs. For this example, since we have two-category data, we can create a segmented bar graph:

Figure 3 – In this graph, each color is depicting an eye color corresponding to hair color as mentioned in table 1.
All images and mathematical drawings were created with GeoGebra.
