JUMP TO TOPIC
Axis (Graph)|Definition & Meaning
Definition
Mathematics defines an axis as a line on which measurements can be made or marked. There are two lines in the coordinate plane that are important: the x-axis and the y-axis. Vertical numbers are represented by the y-axis and horizontal numbers are represented by the x-axis. The coordinate plane is formed by the intersection of these two axes perpendicularly. In coordinate pair (X,Y), X and Y are also referred to as abscissa and ordinate, respectively.
Representation of X and Y Axis
The two basic axes can be represented by the following figure shown below. The horizontal line is making the x-axis (horizontal axis) which is shown by the red line while the vertical line is making the y-axis which is shown by the blue line (vertical axis). Whenever an ordered pair of points is written, the x-axis is written first. Each point on the graph has an ordered pair of x-coordinates leading to y-coordinates with the x-axis corresponding to a point on the graph.
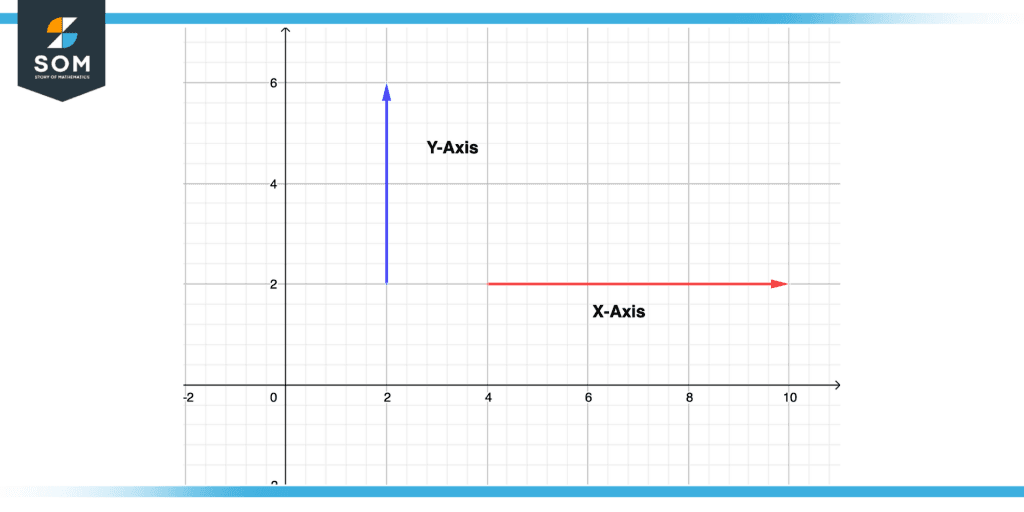
Figure 1 – Axis Representation
Structure of Coordinates on Axis
In coordinate grids, points are located by using numbers. There are two numbers that identify each point; one number on the x-axis and one number on the y-axis, called the x-coordinate and y-coordinate, respectively. It is common to read coordinates in pairs (x, y) in parentheses. In order to understand the coordinate concept we need to first define the following terms.
Origin
The intersection of the x-axis and y-axis is basically the origin which is usually highlighted by “O”.
Abscissa
Consider a point, Abscissa or x coordinate is its distance from the y-axis with respect to the x-axis.
Ordinate
Consider a point, Ordinate or y coordinate is its distance from the x-axis with respect to the y-axis.
All of the above concepts are illustrated in the figure shown below. Point A where x=0 and y=0 or where the x and y axis intersects is referred to as Origin.While X and Y as abscissa and ordinate respectively.
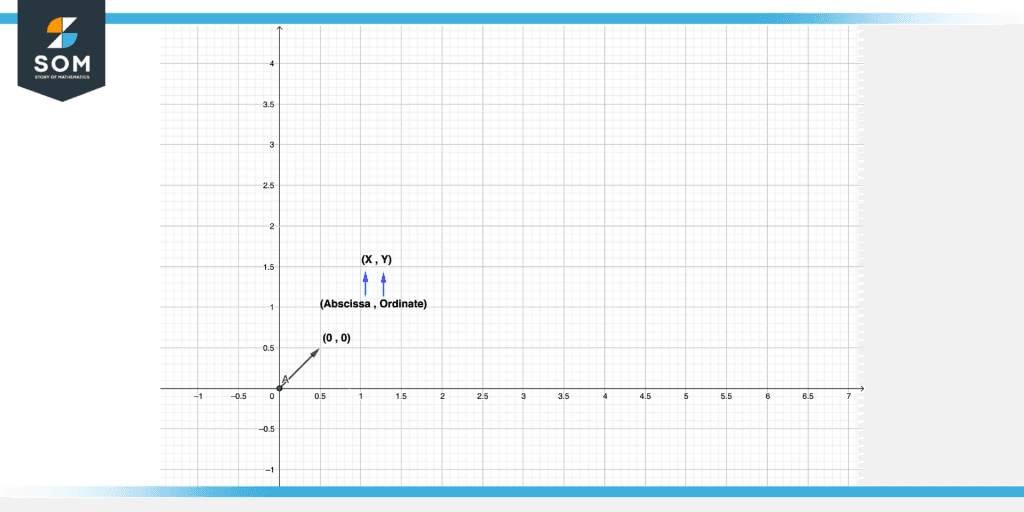
Figure 2 – Representation of Abscissa, ordinate and Origin
The Direction of Movements on Axes
Positive X-Axis
For the positive x-axis, we will move horizontally toward the right side.
Negative X-Axis
For the negative x-axis, we will move horizontally toward the left side.
Positive Y-Axis
For the positive Y-axis, we will move vertically upward
Negative Y-Axis
For Negative Y-axis, we will move vertically downward.
Test Point Plotting on Axis
Consider a point P(1,2), below is the illustration of this point on axes. The x coordinate or abscissa is “1” and the y coordinate or ordinate is “2”.So what we will do is that starting from the origin as a reference we will move 1 step right on the horizontal axis (x-axis) and we will move 2 steps upward on the vertical axis (y-axis).
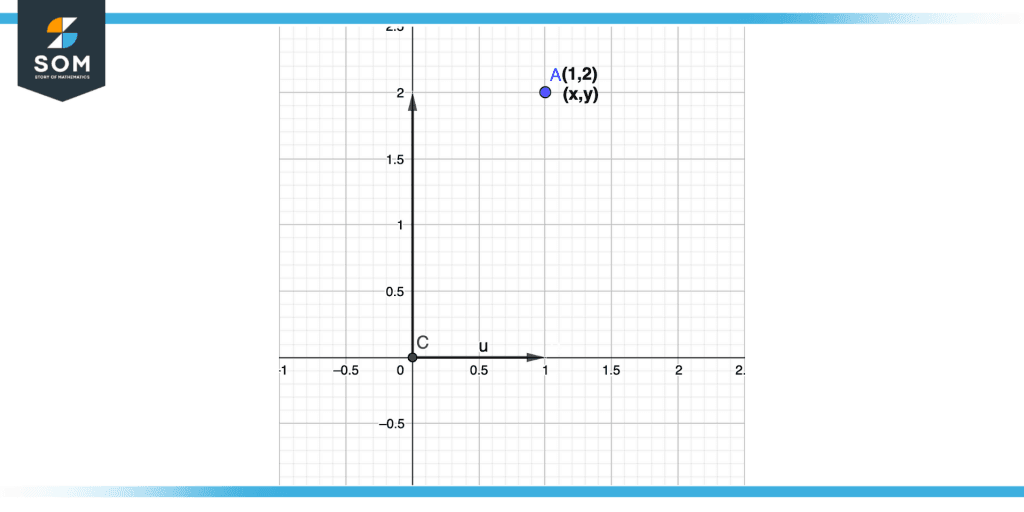
Figure 3 – Test Point Plotting on Axes
Quadrants
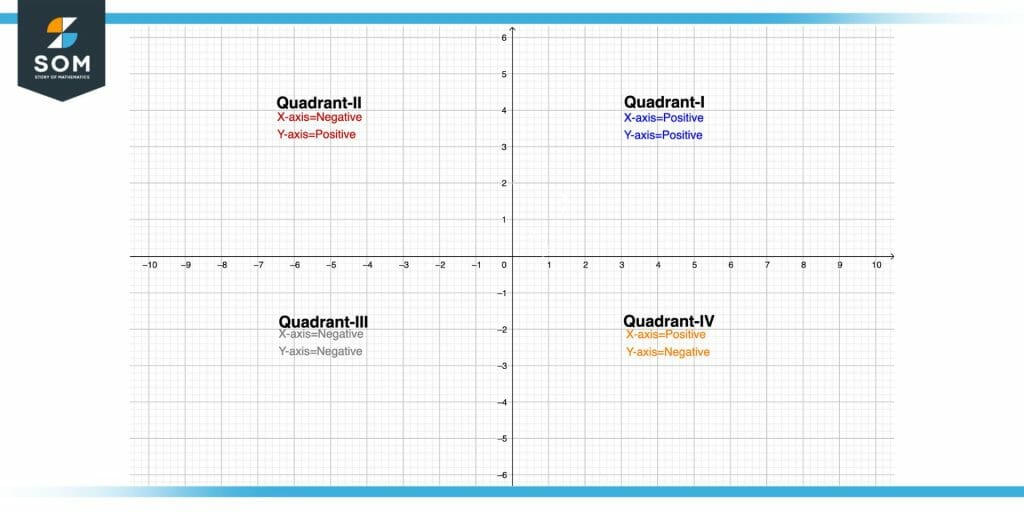
Figure 4 – Quadrants Illustration
X and Y axis divide the coordinate plane into four different halves which are referred to as quadrants. So there are four quadrants depending upon the positive and negative values of x and y. Below is the Illustration of Quadrants. The above figure shows the illustration of quadrants
Quadrant 1
The top right portion of the graph is known as the first quadrant. In this region the value of numbers lying on x and y on both axes are positive.
Quadrant 2
The top left portion of the graph is known as the second quadrant. In this region, the value of numbers lying on the x-axis is negative while the value of numbers lying on the y-axis is positive.
Quadrant 3
The bottom left portion of the graph is known as the third quadrant. In this region, the value of numbers lying on the x-axis is negative while the value of numbers lying on the y-axis is also negative.
Quadrant 4
The bottom right portion of the graph is known as the fourth quadrant. In this region, the value of numbers lying on the x-axis is positive while the value of numbers lying on the y-axis is negative.
Demonstrating Linearity Relation Between X and Y Axis
Consider the following equation
Y = X+1
Now we want to plot it on the x and y-axis. Let’s say we want to plot it for four coordinate pairs. Starting with the value of x from 0 to 3:
X = 0
Y = X+1
Y = 0+1
Y = 1
For x=0, we get coordinate pair (0,1):
X = 1
Y = X+1
Y =1 +1
Y = 2
For x=1, we get coordinate pair (1,2):
X = 2
Y = X+1
Y = 2+1
Y = 3
For x=2, we get coordinate pair (2,3):
X = 3
Y = 3+1
Y = 4
For x=3, we get coordinate pair (3,4):
Now we can see below illustration that there exists a linear relationship between the x and y-axis.
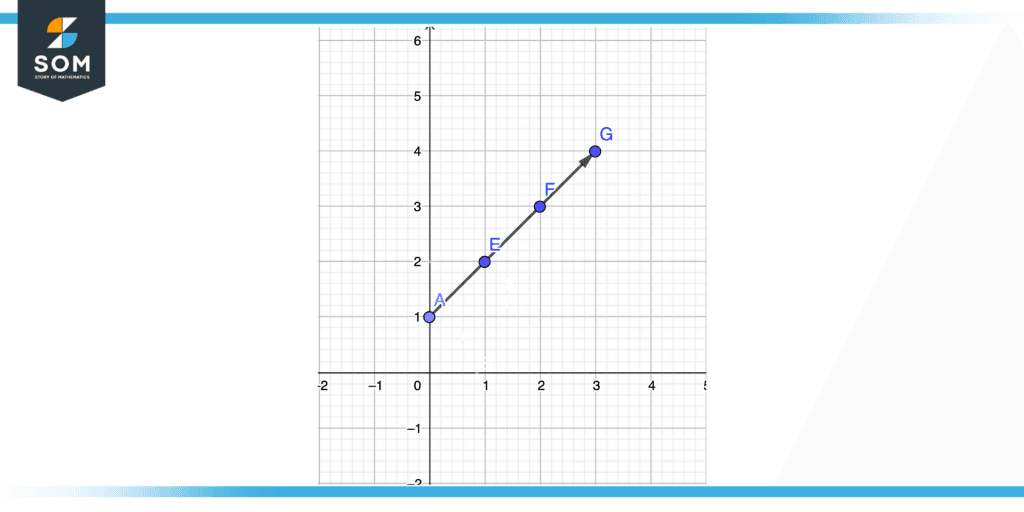
Figure 5 – Linear Relationship Between X and Y axis
The coordinate pair (0,1) is shown by point A.
The coordinate pair (1,2) is shown by point E.
The coordinate pair (2,3) is shown by point F.
The coordinate pair (3,4) is shown by point G.
An Example of Plotting on an Axis Graph
Consider the following coordinate pairs, (2,3), (-3,2), (-1,-2), plot these points on the x-axis and y-axis, and also tell in which quadrant each coordinate pair lies. Write abscissa and ordinate each coordinate pair.
Solution
Let (2,3) be the first coordinate pair, decomposing into abscissa and ordinate.
Abscissa = 2
Ordinate = 3
For plotting, We have to move 2 units in a horizontal direction towards the right while we have to move 3 units in a vertical direction upward with respect to the reference point that origin.
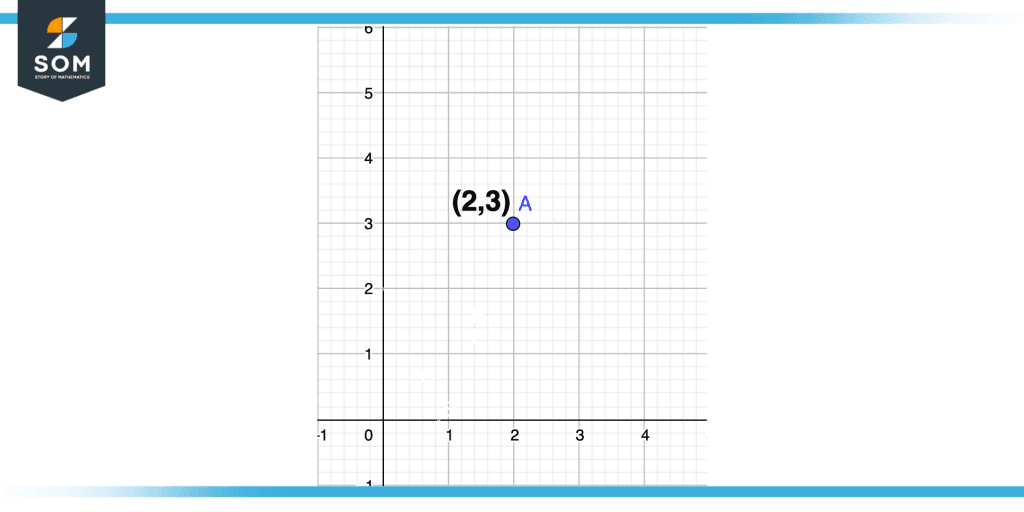
Figure 6 – Coordinate Pair in First Quadrant Plot
As x is positive and y is also positive so the point will lie in the first quadrant as we have seen previously that x-axis and y-axis are positive in the first quadrant. The illustration is shown in the above figure.
Let (-3,2) be the second coordinate pair, decomposing into abscissa and ordinate.
Abscissa = -3
Ordinate = 2
For plotting, We have to move 3 units in a horizontal direction towards the left while we have to move 2 units in a vertical direction upward with respect to the reference point that origin.
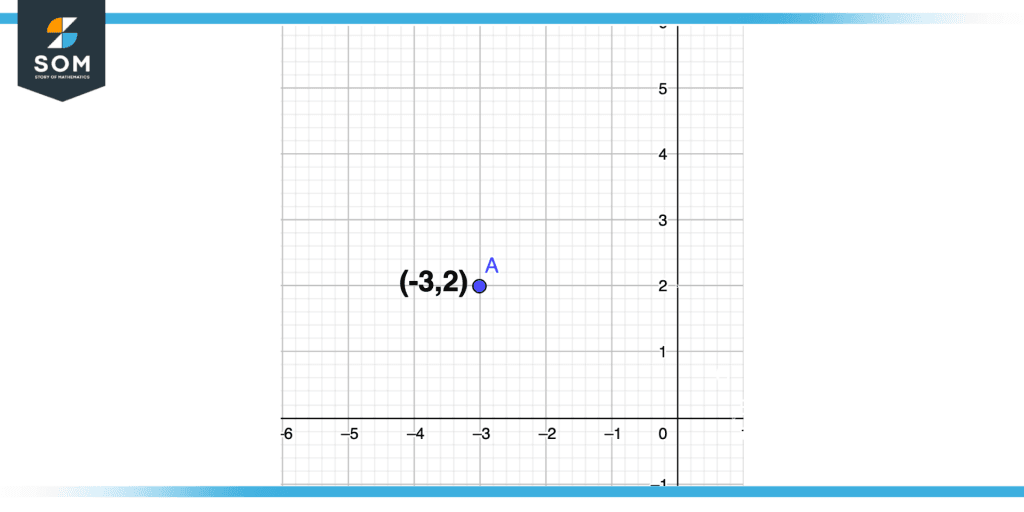
Figure 7 – Coordinate Pair in Second Quadrant Plot
As x is negative and y is positive so the point will lie in the second quadrant as we have seen previously the x-axis is negative and the y-axis is positive in the second quadrant. The illustration is shown in the above figure.
Let (-1,-2) be the third coordinate pair, decomposing into abscissa and ordinate.
Abscissa = -1
Ordinate = -2
For plotting, We have to move 1 unit in a horizontal direction towards the left while we have to move 2 units in a vertical direction downward with respect to the reference point that origin.
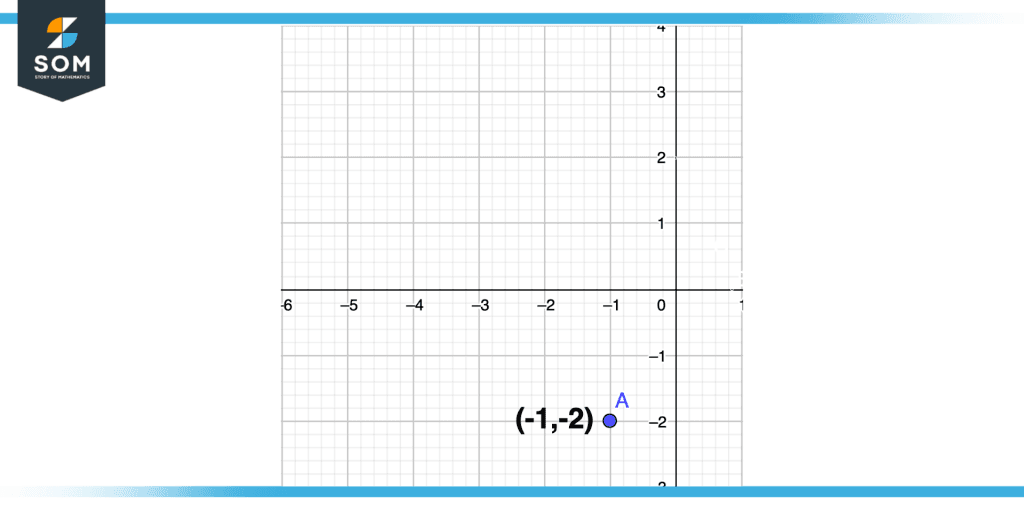
Figure 8 – Coordinate Pair in Third Quadrant Plot
As x is negative and y is negative so the point will lie in the third quadrant as we have seen previously the x-axis and y-axis are negative in the third quadrant. The illustration is shown in the above figure.
All mathematical drawings and images were created with GeoGebra.
