- Home
- >
- Coordinate Plane – Explanation & Examples
JUMP TO TOPIC
Coordinate Plane – Explanation and Examples
 The coordinate plane is defined as a two-dimensional plane used to determine the position of geometric objects with reference to a given point.
The coordinate plane makes it possible to do calculations in geometry. In particular, this allows us to compare geometric objects by using a predetermined reference point.
In this section, we will go over how to plot points on the coordinate plane and determine the position of given points. If you have not already done so, you should quickly review coordinate geometry to get the most out of this section.
This topic covers:
- What is a Coordinate Plane?
- Coordinate Plane Scale
- Coordinates
- Positive Coordinate Plane
- Negative Coordinate Plane
- Quadrants
What is a Coordinate Plane?
A coordinate plane is a system for plotting points and other geometric objects in two dimensional space. Of all coordinate planes, the most famous and commonly used is the Cartesian coordinate system. This name refers to the French mathematician, Rene Descartes, who was the first to publish a description of the plane. Because it uses a grid, this system is also sometimes known as rectangular coordinates.
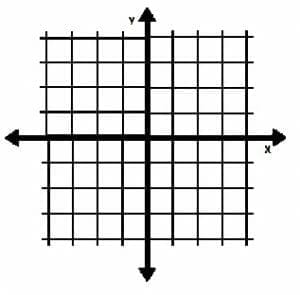
The coordinate plane consists of two lines called axes that meet at a right angle. The vertical line is called the y-axis, while the horizontal line is called the x-axis. Their intersection point is called the origin.
In certain situations, the x-axis is also known as the “independent variable.” Similarly, the “dependent variable” is the y-axis.
The coordinate plane essentially expands the concept of a number line to two dimensions. Just as we can plot both positive and points on a number line, we can plot both positive and negative points on the coordinate plane.

Like the number line, the coordinate plane needs to have a scale.
Coordinate Plane Scale
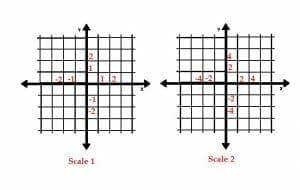
The coordinate plane usually features many horizontal and vertical lines that make it look like a grid. These lines are usually evenly spaced and are marked by numbers. The distance represented by the space between two of these lines is known as the scale.
For example, the coordinate plane shown below on the left has a scale of 1 because the distance between each of the horizontal and vertical lines represents a distance of one unit.
In the coordinate plane below on the right, however, the scale is two because the distance between each of the horizontal and vertical lines represents a distance of two units.
Coordinates
Recall that, on a number line, one number is enough information to uniquely identify a point. In two-dimensional space, however, two numbers are needed to uniquely identify a point. These are called coordinate pairs, and they take the form (x, y).
The x-value of a coordinate pair represents the point’s position on the x-axis. Likewise, the y-value of a coordinate pair represents the point’s position on the y-axis.
These numbers are continuous, so any positive or negative number can be a part of a coordinate pair. For example, the points (-1, -0.1), (2, π), and (3⁄4, -5) are all coordinate pairs.
When plotting points on a coordinate plane, people usually choose a scale based on the points they have. Typically, this is either the greatest common factor or a multiple of the greatest common facts.
For example, suppose a researcher were to plot the points (36, 12) and (48, 72). A scale of 12 would make the most sense because 12, 36, 48, and 72 are all multiples of 12.
Note, however, that this may not always be possible. If the coordinates include too many numbers without common factors or include irrational numbers, picking a scale so that all or most points are on grid lines will be difficult or impossible.
Positive Coordinate Plane
On a number line, motion to the right is considered positive. Similarly, in the coordinate plane, positive movement is any movement upwards and any movement to the right.
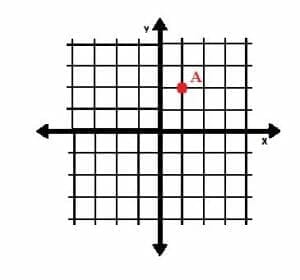
Consider, for example, the point A=(1, 2).
The x-value of this coordinate pair is 1, and the y-value is 2. It is clear that both of these numbers are positive. Therefore, the point will lie one unit to the right of the origin and two units above it.
The graph below shows the plotted point.
Negative Coordinate Plane
Leftward motion is negative motion on a number line. Likewise, movement to the left and movement downward are both negative on the coordinate plane.
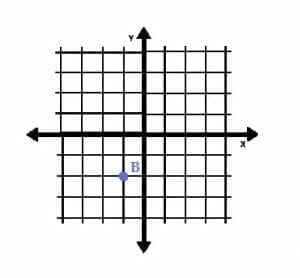
Consider, for example, the point B=(-1, -2).
The x-coordinate is -1, and the y-coordinate is -2. This means that the point lies at a position one unit to the left of the origin and two units below it, as shown.
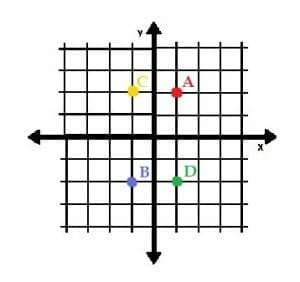
It is also possible to have coordinate pairs that are a mix of positive and negative values. For example, the point C=(-1, 2) has a negative x-value and a positive y-value. This means that it lies one unit to the left of the origin and two units above it.
Conversely, the point D=(1, -2) has a positive x-value and a negative y-value. It lies one unit to the right of the origin and two units below it.
All four points are plotted in the plane below.

Quadrants
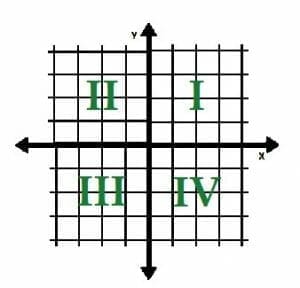
The x- and y-axes effectively divide the Cartesian coordinate plane into four sections. These sections are called quadrants, and they have names.
The first quadrant, Quadrant I, is to the upper right of the origin. All points in this quadrant have positive x and y-coordinates. Because data sets often include only positive values, this quadrant is sometimes shown by itself.
The quadrants then move counterclockwise around the plane. The next two are Quadrant II, which has negative x-coordinates and positive y-coordinates, and Quadrant III, which has negative x and y-coordinates. These quadrants are to the upper left and lower right of the origin respectively.
Finally, Quadrant IV has positive x-coordinates and negative y-coordinates.
Examples
In this section, we will review some examples to learn more about the coordinate plane.
Example 1
Plot the points A=(-3, 2) and B=(2, -3). Which quadrants are the points in? What is the relationship between these two points?
Example 1 Solution
The point A has an x-coordinate of -3 and a y-coordinate of 2. This means that it lies three units to the left of the origin and two units above it.
The point B has an x-coordinate of 3 and a y-coordinate of -2. This means that it lies three units to the right of the origin and two units below it.
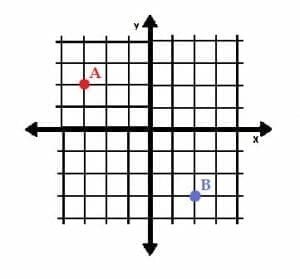
From the coordinate plane, we can see that A lies in Quadrant II while B lies in Quadrant IV.
To move the point A to the point B, we must move it 6 units to the right and 4 units down. This corresponds to the difference between the x-values and the y-values of the coordinates.
Example 2
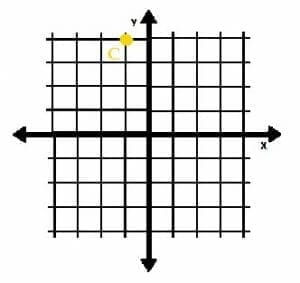
The point C is shown on the graph below. If the coordinates of C are (a+1, 2b), what are the values of a and b?
Example 2 Solution
We first have to find the coordinates of the point C.
It is clear that the point lies one unit to the left of the origin and four units above it. Therefore, its coordinates are (-1, 4).
Since C has coordinate (-1, 4) and also (a+1, 2b), we can set the x and y values equal to each other:
-1=a+1
-2=a,
and
2b=4
b=2.
Example 3
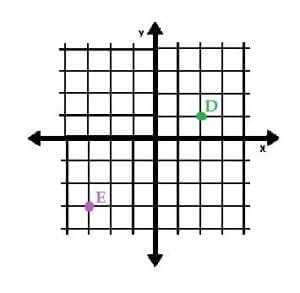
The point D lies at the position (4, 2). What are the coordinates of the point E? Hint: pay attention to the scale of the graph.
Example 3 Solution
The grid lines on the coordinate plane are not labelled, so we have to use the point D to figure out the scale.
The point D is at (4, 2). It is at the intersection of the second vertical grid line to the right and the first horizontal grid line above the origin. Therefore, the space between each grid line is 2 units, and the plane has a scale of 2.
E is located at the intersection of the third horizontal line below and the third vertical line to the left of the origin. Since each line represents 2 units, the point E lies at (-3×2, -3×2), or (-6, -6).
Example 4
The park is 1.5 miles directly south of City Hall. Jana’s house is 2.5 miles North and 1 mile West of City Hall. Where is Jana’s house relative to the park?
Example 4 Solution
In this case, it would help to draw a map. Let the park be the point P, and let City Hall be the point C. Jana’s house is the point J.
Since the original positions of the park and Jana’s house are relative to City Hall, we can use City Hall as the origin of our map.
We also need to pick a scale. It often makes sense to pick a scale that is the greatest common factor of the coordinates. Since several of the given coordinates are given in half miles, it makes the most sense to have a scale of ½.
On a map, it is customary to choose South and West as negative and North and East to be positive. In this case then, the coordinates of the park are P=(0, -1.5). The coordinates of Jana’s house are J=(-1, 2.5).
Keeping the scale in mind, the park would be at the intersection of the y-axis and the third horizontal grid line below the origin since 1.5⁄0.5=3. Likewise, Jana’s house would be at the intersection of the second vertical grid line to the left of the origin and the fifth horizontal grid line above it since 1⁄0.5=2 and 2.5⁄0.5=5.
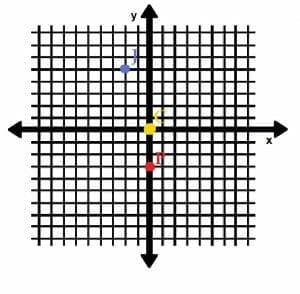
To get from P to J requires one to move 4 miles, or 8 units, North and 1.5 miles, or 3 units, West.
Example 5
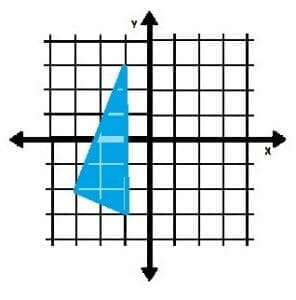
In which quadrant(s) does the figure lie?
Example 5 Solution
Two of the vertices of the triangle lie in the quadrant that is down and to the left of the origin. This is Quadrant III.
The last one lies up and to the left of the origin. This is Quadrant II.
Since no part of the triangle lies in any part of the other two quadrants, the object only lies in Quadrants II and III.
